My latest complaint about France: A deep dive into cross-exchange arbitrage

A post on X this weekend identified what its author called a simple inefficiency in Polymarket’s 2026 World Cup winner market. The reasoning was that if you add up the displayed odds on the fourteen favorites it would come to about 88%. If you bought 100K contracts of each, then you’d spend $88K to collect $100K when any of them won on July 20. A clean $12K return locked in by midsummer for nearly 14%.

There was obviously no way this could be true, so I quickly fired off a skeptical comment and made a mental note to fact check later on (if there was time). Don’t blame me—those are the terms and conditions of using X.

Curiosity ended up getting the best of me, so I actually did look into it. After working out the numbers at the time (~36 hours after the post), the basket cost came to $93K after order book lift and fees. It’s not exactly risk-free arbitrage, but it’s still a reasonable position to consider for the relative tail risk.

The surprise
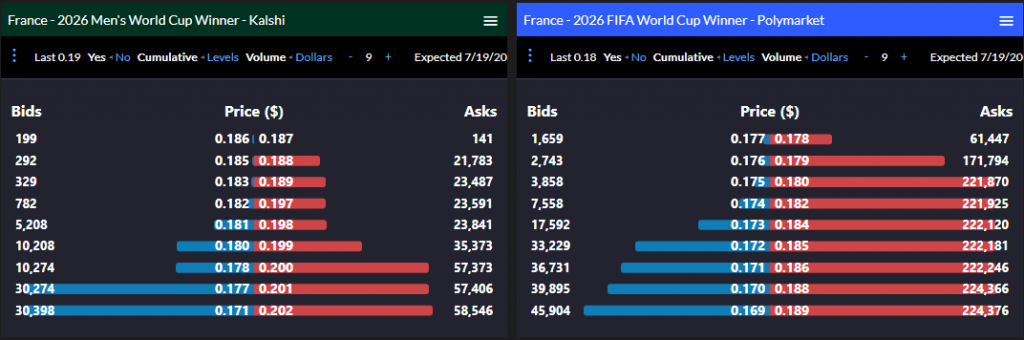
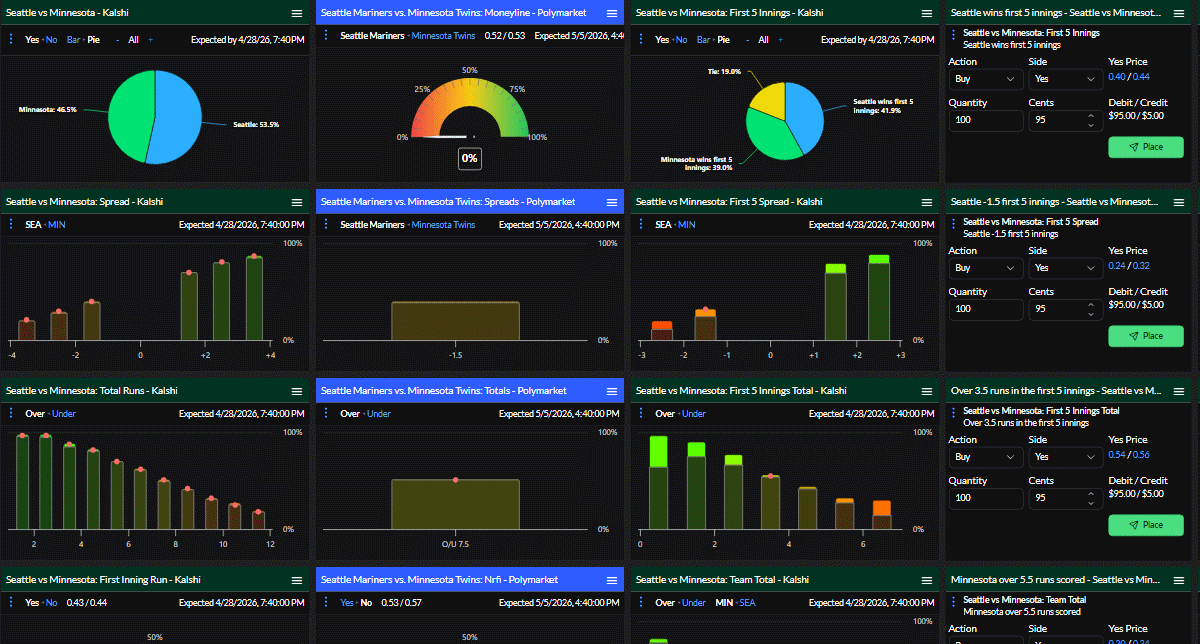
While I was checking the basket math against the books, I noticed something else. Pulling France’s order book on Polymarket—the most-traded contract and favorite in the event—I noticed the best ask sat at $0.178. I sanity-checked the same contract on Kalshi. France there sat at $0.187 on the offer side. Identical underlying outcome, 90 basis points apart. That’s a meaningful gap, and unlike the basket trade, it actually looked like real arbitrage.

The textbook arb is straightforward. Buy France Yes on Polymarket where it’s cheap. Buy France No on Kalshi where it’s expensive. The basket pays $1.00 either way:

• If France wins, the Polymarket Yes settles to $1.00 and the Kalshi No to zero.

• If France loses, you get paid the $1.00 on Kalshi instead of Polymarket.

The total entry cost per share pair: $0.178 + $0.814 = $0.992. Gross profit: $0.008 per pair. That’s about 80bps of risk-free return locked in over six and a half weeks, plus whatever yield the platforms pay on the locked capital. That sounds like a real free trade.

I went looking for the catch.

The first answer: fees

Both venues charge takers on a quadratic formula where the fee is a function of the number of contracts, trade price, and a taker rate. The quadratic nature is designed to max at peak uncertainty ($0.50) and trail off at the edges. The symmetry ensures the same fee applies at $0.30 and $0.70 to disincentivize siding gymnastics.

The base taker rates differ. Kalshi charges 0.07 across the board. Polymarket charges it by market category:
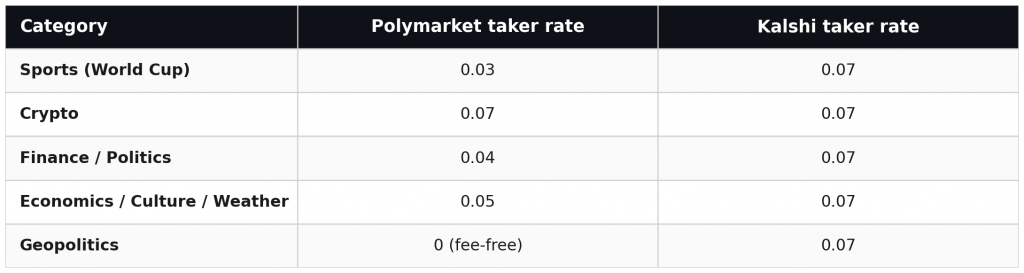
On the World Cup specifically, Polymarket’s sports contracts charge three-sevenths of Kalshi’s rate. Here’s the arb math per share pair:
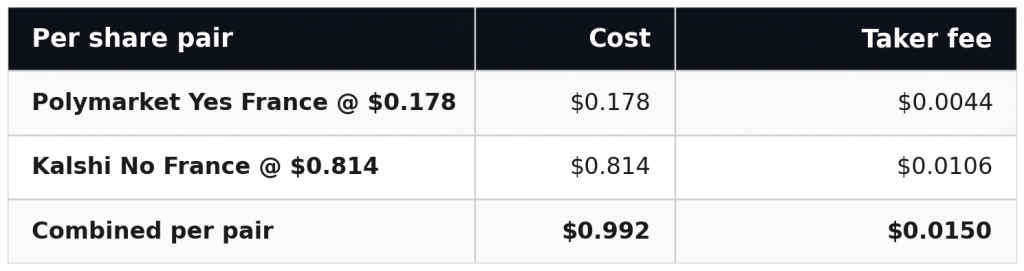
The gross arb spread is $0.008 per share pair. Combined taker fees are $0.015 per pair. Net of fees, the trade is a $0.007 loss per pair, which is about 70bps on the basket cost. The fees alone close the case for the strategy.

Good. That explains why the arb doesn’t get done. But it doesn’t explain why the 90bps gap exists in the first place. Fees prevent it from being captured. Something else has to be creating it.

The candidates that fell short

I tried APY first. Both venues pay yield on positions: Polymarket at 4% and Kalshi at 3.25%. The 10-year Treasury at 4.384% as the reference rate as of this writing. The 75bps APY differential means makers on Polymarket earn more on locked capital, which translates to a lower breakeven ask for the same expected return. The magnitude over a 75 day holding period works out to 15-25bps in the right direction. It’s substantial and in the right direction, but not enough.

Maker fee asymmetry was the next candidate. Polymarket sports makers face zero direct fees plus an 11bps rebate from the maker rebate program at France’s price level. Kalshi makers pay 25% of the taker fee, which is about 27bps at $0.187. The net swing in maker economics is 25-40bps. Also in the right direction, but even when combined with APY it’s only 40-65bps against a 90bps gap.

Demand-side asymmetries came next. Kalshi runs a Sportsbook Hedging Rebate Program that rebates taker fees for US-based sportsbook operators hedging their book exposure. Sportsbooks running parlay and futures books on the World Cup are short the popular favorites, which means they buy Yes on those favorites to hedge. This introduces directional buy-side pressure on Kalshi that would help push in the right direction. It’s a plausible contributor, but it’s hard to size precisely from outside and doesn’t seem to close the magnitude gap significantly.

Stacking everything quantifiable in the right direction got to 60-70bps of the 90bps gap. In a world where the kind of money that can move markets likely has access to either exchange, what could the reason be for the rest of the gap?

Let’s hear it for the longshots
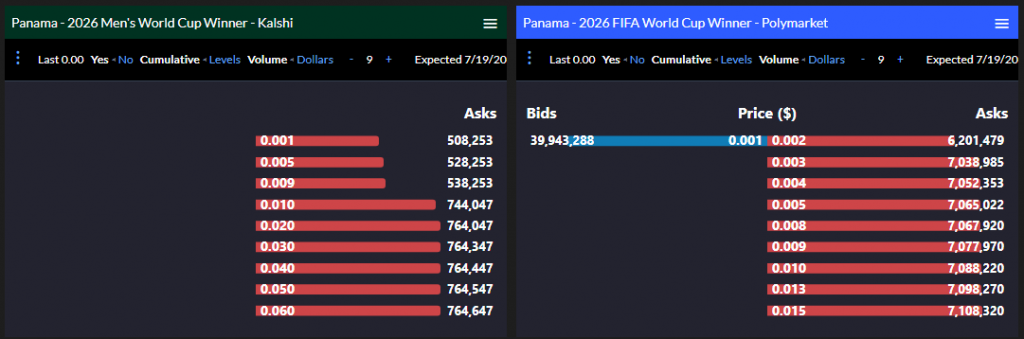
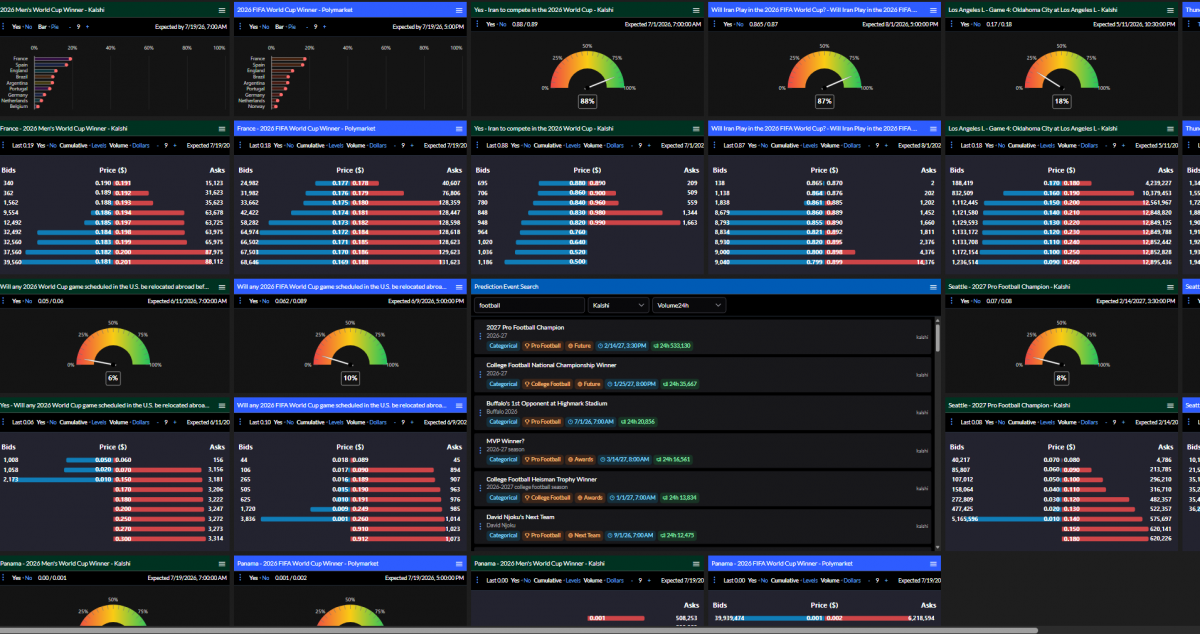
One of the odd observations I noticed across exchanges is that the longshot liquidity on Kalshi is understandably low while the same liquidity on Polymarket is unbelievably high. Even setting aside Panama’s home field advantage on Polymarket’s international exchange, the fact that they have over 7M contracts on offer below a penny and nearly 40M offers to buy at the $0.001 level seems…surprising? But it’s actually the same for all the longshots. Kalshi has no buy interest on any of them, but Polymarket has millions of resting offers to buy any longshot. In fact, the volume on both sides of the spread thins out as the teams become more competitive.

The structural answer

Polymarket—specifically the offshore entity running on Polygon—has an atomic split-and-merge mechanism. This crypto process works notably different than the DCM model operated onshore under the CFTC and changes the nature of how market makers operate.

For maximum capital efficiency, market makers split USDC into a set of tokens that represent every possible outcome for the “2026 FIFA World Cup Winner”. They then trade these tokens as markets in various combinations across Polymarket. At any point they can get a full set that they merge back into USDC. I’m oversimplifying, but it’s a critical part of their infrastructure that allows convenient conversion between tokens that represent positions and cash that can be executed unilaterally—in seconds and without a counterparty.

Remember those longshot bids? It’s not because they think Panama is the next Ecuador. Market makers need those cheap tokens to balance their books and merge complete sets back into USDC.

This has a pinning effect on the sum of market probabilities within an event such that the total probability remains very close to 100%. On exchanges where all contracts are independent—like Kalshi or Polymarket US—market makers need an overround buffer to account for a variety of risks.

The financial engineering term for what this enables is zero basis risk on balanced books. A Polymarket maker holding inventory across all teams, which is naturally produced by the mint operation, can reclaim collateral instantly whenever inventory balances out because the protocol recognizes that exactly one team will win and the entire basket is worth $1 at resolution. There’s no capital lockup cost and no carry overhead. Their marginal hedging cost on this negative risk market is effectively zero.

That “negative risk” concept is key here because it also enables them to sell No on multiple teams without having to collateralize every position. They bought the full set of tokens for 1.00, so they can sell whichever ones they want without investing additional capital to cover the downside.

Kalshi faces positive marginal hedging cost. Each contract is independently created by the matching engine when a buyer and seller cross. No participant can unilaterally mint or burn complete sets. The only equivalent to Polymarket’s atomic redemption is to buy a complete set of Yes tokens at the asks and wait until resolution to collect $1. For a 75 day World Cup contract, that’s locking $1 of capital per share set for the entire time, with an opportunity cost of roughly 2.5 cents per set at the gap between Treasury yield and Kalshi’s APY. The arb only fires when the gap is wide enough to clear that penalty.

The practical consequence is that Polymarket’s sum of midpoints on the World Cup market is constrained by atomic arbitrage to sit very near $1.00 in real time. Kalshi’s sum can drift above $1.00 by something like 150-250bps before the wait-until-resolution arb starts to fire. This is the venue’s structurally allowed overround. Within that float band, the marginal hedging cost asymmetry between the venues’ market makers manifests as Kalshi midpoints drifting in the direction of accumulated inventory imbalance, while Polymarket midpoints stay closer to fair value because the structural mechanism prevents the same kind of one-sided accumulation.

That’s the structural answer. It’s not APY, it’s not fees, it’s not the maker rebate program, though all of those contribute to the magnitude inside Kalshi’s float band. It’s that one venue has an atomic within-market arbitrage that the other doesn’t, and that single architectural difference does most of the work.

What the pattern looks like across markets
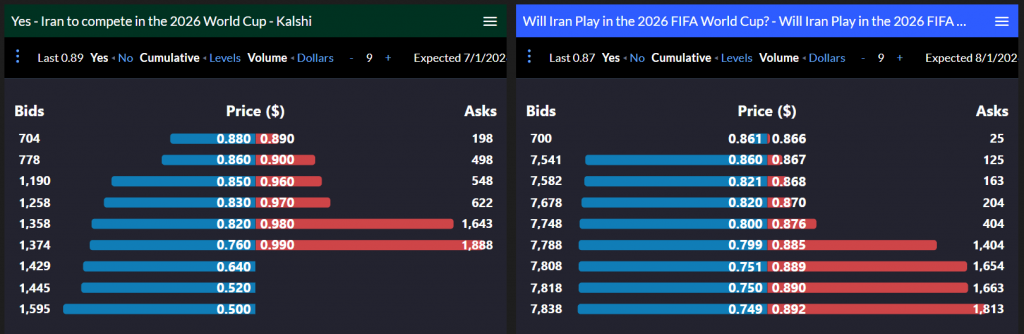
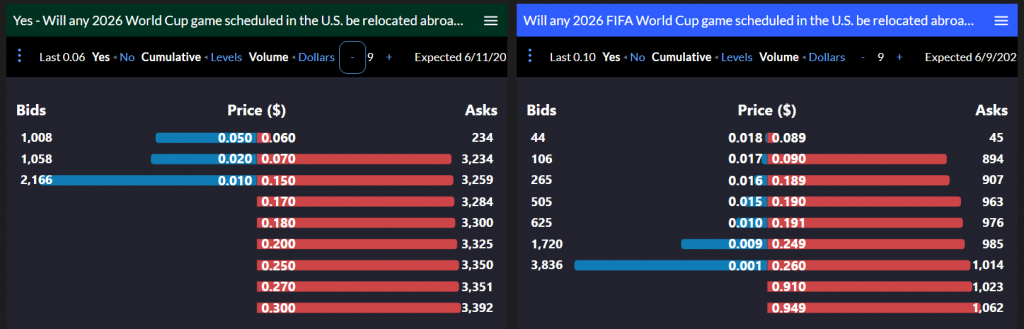
That mechanism makes falsifiable predictions about how cross-venue gaps should behave on different market shapes. Four observations from this weekend across different event types:
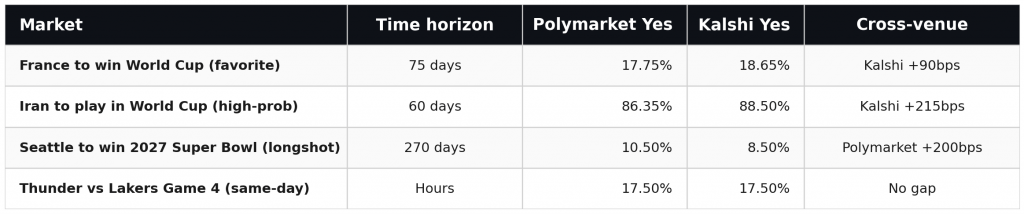
The pattern is consistent with the structural argument once you allow for three qualifiers.

First, the direction depends on how participant flow accumulates inventory on Kalshi. On the World Cup market, US retail flow concentrates on the popular favorites, like France, Spain, England. Kalshi makers selling Yes on the favorites accumulate short favorite inventory, raise the midpoint to compensate, and the cross-venue gap shows up with Kalshi higher on the favorites. The Iran-to-play binary follows the same pattern: insurance-style Yes buying on a high-probability outcome pulls Kalshi above Polymarket by 215bps.
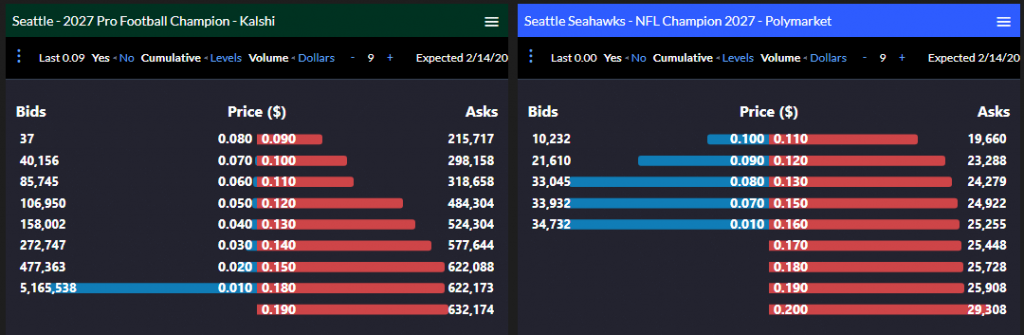
On the Seattle Super Bowl market, the dynamic reverses—US retail isn’t buying Yes at the moment, so Kalshi makers accumulate Yes-Seattle inventory the inverse direction. They clear it by lowering the midpoint, and Kalshi sits below Polymarket by 200bps. It’s the same mechanism, but in the opposite direction, and predictable from whether the contract is a favorite or longshot in the Kalshi participant base.
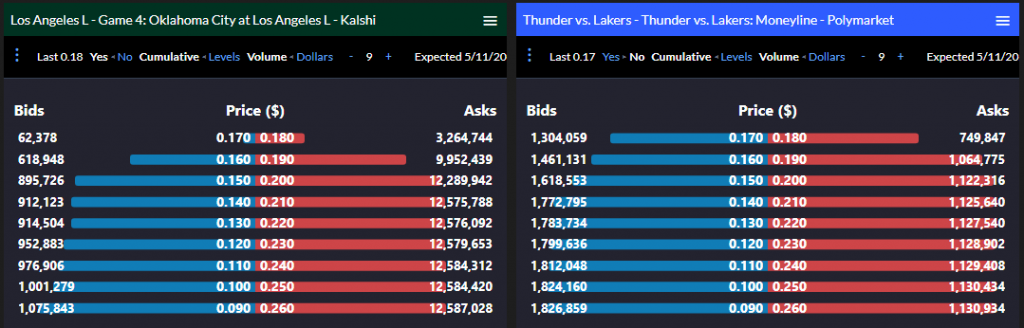
Second, the asymmetry only manifests when time to resolution is long enough for it to matter. Monday’s Lakers/Thunder NBA playoff game has the underdog Thunder priced at 17.5¢ on both Kalshi and Polymarket. It’s an identical bid/ask with no cross-venue gap. With hours to resolution rather than months, the opportunity cost of locking capital on either venue is essentially zero, so the wait-until-resolution arb on Kalshi becomes nearly costless to execute. Kalshi’s overround compresses to match Polymarket’s pegged equilibrium. The structural asymmetry only produces visible cross-venue gaps when capital has to sit long enough for the cost differential to accumulate.

Third, independent contract models like Kalshi require market makers to find counterparties for every trade. When inventory starts to build up there’s pressure to offload that requires price adjustment that may not be in line with market views.

In other words, it seems clear why Yes prices are higher on Kalshi than Polymarket. But since those same rules should also apply to the No contracts, why aren’t those more expensive as well? Why are we seeing sub-penny spreads on popular markets instead of Yes and No prices that are both more expensive than their Polymarket counterparts?

The easiest explanation is that Kalshi traders have a bias towards buying Yes. As Yes demand floods in, Kalshi market makers accumulate one-sided inventory risk. To attract the No side necessary to balance their books, they don’t just widen spreads; they must structurally lower the No price to a level that incentivizes professional arbitrageurs to step in. In this light, the cheap No on Kalshi isn’t just a pricing error. It’s a liquidity bounty paid by the platform to anyone willing to take the unpopular side of a retail-heavy trade.

This isn’t a complete theory. The magnitudes vary considerably across the observations and aren’t cleanly attributable to specific factors. But the directional pattern—Kalshi drifts where flow accumulates, Polymarket stays anchored, gaps compress with time—is one observable signature of the architecture difference between the two venues.

The regulatory wrinkle

There’s a wrinkle worth flagging, because everything I’ve described so far refers specifically to offshore Polymarket as the entity running on Polygon, settling in USDC, available to international users. Polymarket also operates a US-licensed entity called Polymarket US, structured as a CFTC-regulated Designated Contract Market. That’s the venue available to US participants.

Polymarket US does not have the unilateral mint mechanism. Every contract on Polymarket US has to come from a matched counterparty at trade time. The matching engine handles complete set creation when buy-side and sell-side flow happen to be price-complementary at the same moment, but during one-sided regimes—exactly the conditions where offshore Polymarket makers shine—Polymarket US makers either eat directional risk into their book or pull quotes. There’s no unilateral split operation. Architecturally, Polymarket US looks much more like Kalshi than like its offshore namesake.

Several other operational differences compound the architecture choice. Capital releases on Polymarket US run through the clearinghouse on intraday cadence rather than block-by-block on Polygon. The same dollar can be split, sold, repurchased, and merged ten times an hour on offshore Polymarket; on Polymarket US, even efficient netting takes minutes to hours. Access requires either Clearing Member status, with the regulatory commitments that come with it, or routing through a Futures Commission Merchant, which adds per-contract fees, KYC overhead, and credit line management. And makers running books on both Polymarket entities can’t move capital frictionlessly between them. They have to deal with different jurisdictions, different KYC regimes, different collateral pools, and USDC on one side with USD wires on the other. The natural cross-venue hedge for a Polymarket US position is the corresponding offshore Polymarket position, and the operational silo between them prevents that hedge from being free.

The pricing efficiency that pegs offshore Polymarket’s sum of midpoints near $1 isn’t available on the US-licensed venue at all. US participants legally choose between Kalshi and Polymarket US, both of which run wait-until-resolution architectures. That isn’t an oversight by Polymarket US, or a failure to optimize. The regulated wrapper costs real money to operate, and Polymarket US’s business model emphasizes institutional onboarding, market data revenue, and product breadth expansion rather than competing with offshore on retail spreads. The marginal market maker hedging cost on the US side is unambiguously higher, and that has to be priced in somewhere.

Why this matters beyond the gambling story

This isn’t just about prediction market gambling, and I think this is where the story gets interesting for legitimate finance.

Event contracts—which are any derivatives whose payoff depends on the outcome of a discrete real-world event—are an emerging category that extends well beyond sports and politics. Catastrophe bonds, weather derivatives, parametric insurance, prediction contracts on macroeconomic data releases, credit-event swaps that hinge on binary triggers: all of them are event contract instruments, all of them face the architectural choice we’ve just walked through. You can build the platform on an atomic split-and-merge architecture that produces tight pricing through within-venue arbitrage. You can build it on a wait-until-resolution architecture that’s simpler to clear and regulate but allows persistent overrounds. Each has tradeoffs, and the tradeoffs map directly to pricing efficiency participants experience.

For US-regulated event contract markets specifically, there isn’t really an architectural choice. The CFTC framework that governs both Polymarket US and Kalshi requires central clearing, which is fundamentally incompatible with the unilateral mint mechanism that produces offshore Polymarket’s pricing tightness. Operating legally in the US and operating with atomic split-and-merge are mutually exclusive options under current rules. For that capability to become available to US institutional participants (buyers of weather derivatives, parametric insurance underwriters, hedge funds expressing macro views through event contracts, corporates hedging operational exposures with binary triggers), the regulatory framework itself would need to evolve.
Until that happens, US institutional participants entering event contract markets are working with the wait-until-resolution model by default. Their spreads will be wider, their effective execution costs will be larger, and their overrounds will float higher than what a venue with atomic redemption could offer. Not because the platforms running those markets are doing anything wrong, but because the architectural choice is constrained by what the regulatory framework currently permits.

The architectural choice isn’t going away

The viral post that pulled me into this rabbit hole was about a sports trade. The interesting question underneath it is about how event contracts get priced everywhere they exist. Every trader on these venues, every operator building a platform in this space, every regulator drafting framework for the category, is making a bet about which architecture is the right one—whether they know it or not.

The two prediction markets I was looking at this weekend made theirs visible. Offshore Polymarket runs atomic split-and-merge arbitrage and gets tight pricing pegged near fair value. Kalshi and Polymarket US run traditional clearinghouse architecture by regulatory necessity. Atomic split-and-merge isn’t permitted on a CFTC-regulated DCM, so the architecture and the US-regulated profile come together as a single package.

The architectural choice isn’t going away. It’s going to keep showing up across the legitimate finance applications of event contracts that are coming online over the next few years. The participants who understand the choice will be better positioned than the ones who treat displayed prices as equivalent across venues. And the regulatory framework that emerges for US event contracts—whether it stays where it is or evolves to accommodate atomic redemption architectures—will determine whether US institutional participants ever access the pricing efficiency that’s currently sitting offshore.
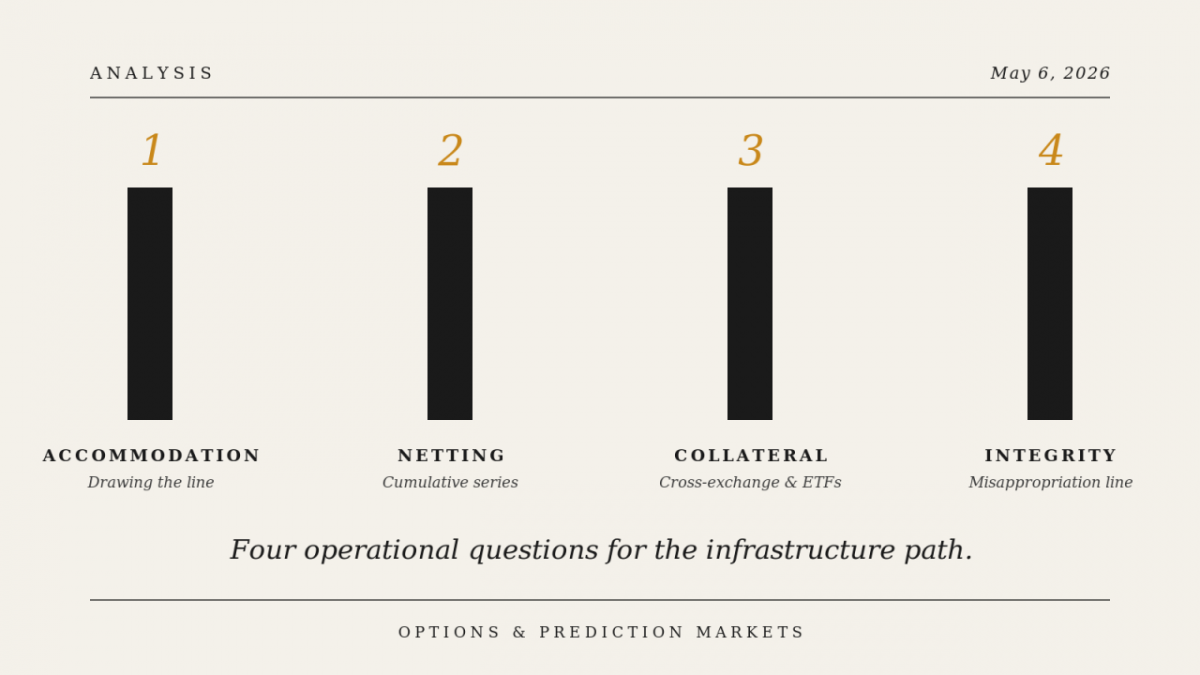
Four Operational Questions That Determine Whether Event Contracts Become Institutional Infrastructure

If the destination is mainstream investing, here is the work that gets us there.

Yesterday’s special edition issue argued that the CFTC’s prediction market comment record reveals a quiet consensus underneath the gambling debate: the CFTC is the right regulator, event contracts are derivatives, and mainstream investing access is the destination. The fight is about the shape of the path. This issue is about the path itself.

Four operational questions determine whether event contracts become infrastructure that traditional finance can responsibly serve, or whether they stall as a retail-flavored category outside the existing perimeter. These are the four I went deep on in my own filed comment letter to the CFTC. They are underrepresented in the comment record relative to their importance to where the category actually lands.

1. Drawing the line between contracts that warrant federal accommodation and contracts that do not

The CFTC has to decide which event contracts belong inside the federal financial market perimeter and which belong in some other regulatory framework. Most submissions answer this with categorical lists (sports out, elections out, weather in, regulatory outcomes in) or with state statute deference (whatever the state calls gambling, treat as gambling).

Both approaches are politically unstable. Categorical lists get litigated as the boundary shifts and as new contract types emerge. State statute deference imports the regulatory politics of incumbent gambling industries that have a structural interest in maintaining control over event-based risk transfer.

A more durable approach is structural. Ask whether a contract enables genuine risk transfer or price discovery for measurable economic exposure, or whether it has been designed primarily to optimize for engagement rather than for markets. I proposed three prongs in my filed letter: hedging utility, price discovery utility, and genuine risk transfer with measurable economic exposure beyond entertainment value. Contracts that satisfy at least one prong qualify. Contracts that fail all three may remain permissible under other regulatory frameworks but do not warrant the federal accommodation that DCM listing provides.

The structural test isn’t about what kind of contract it is. It’s about what kind of work the contract does.

2. Making intra-series netting work without compromising clearinghouses

Full collateralization is the right baseline for binary event contracts in the near term. A contract priced at $0.85 on Tuesday can resolve at $0.00 Wednesday morning when the event does not occur. There is no gradual loss for a clearinghouse to collect against; the position value can be extinguished instantaneously at resolution. Full collateralization fits that settlement dynamic. Variation margin doesn’t.

Within full collateralization, intra-series netting on direction market groups (cumulative event contract series in which the markets are not mutually exclusive) is already established CFTC-approved practice. Kalshi Klear’s DCO rulebook, registered by the Commission in August 2024, implements collateral return for direction market groups. When a participant holds offsetting positions within such a series, the bounded payoff range means the over-collateralized portion can be returned without compromising clearinghouse solvency.

Let’s walk through a practical example. Take a Fed funds rate market with cumulative thresholds and a view that the rate will be 3.5%+ but not 4.0%+. Pairing long YES on “3.5%+” with long NO on “4.0%+” creates a bounded position: at least $1 per pair regardless of outcome, $2 in the target range. If YES on 3.5%+ trades at $0.65 and NO on 4.0%+ at $0.70, the pair costs $1.35 in collateral. Without netting, all $1.35 stays locked. With Collateral Return recognizing the guaranteed $1 minimum, only the $0.35 at-risk portion is locked. Same exposure, roughly 75% less capital tied up. Option traders will demand this treatment.

And it isn’t just a proposal. It’s already running on at least one CFTC-registered DCO. The Commission should affirm intra-series netting on direction market groups as a baseline standard for any DCM clearing cumulative event contracts. Capital efficiency on range views matters for participants holding macro variable positions, and the regulatory precedent is already in place.

3. The cross-collateral pathway that lets traditional finance participate

Recent SEC filings for event contract ETFs (Bitwise, Roundhill, GraniteShares), the launch of perpetual futures on Polymarket and Kalshi, and the emergence of prediction market exposure within retirement asset distribution channels all signal that the regulatory perimeter around event contracts is already evolving past the binary contract on a single venue.

For traditional brokerage, custody, and asset management infrastructure to participate, the framework needs to identify how ETFs holding event contract positions could serve as collateral within a clearinghouse’s risk model, and how cross-exchange collateral arrangements between CFTC-regulated DCMs and other regulated venues could be structured. This is the operational architecture that lets institutional brokerage and asset management firms participate in event contracts within their existing regulatory frameworks.

Without it, institutional adoption stalls. Event contracts may get federal accommodation but never reach mainstream brokerage menus, because the integration architecture is not in place. If the destination is mainstream investing access, this is the load-bearing infrastructure question. It is the difference between a perimeter that exists on paper and one that is actually used.

These cross-collateral arrangements are also the infrastructure precondition for portfolio margin frameworks adapted to event contract portfolios. Once positions can be evaluated across products and venues, capital requirements can be calculated against a participant’s net risk rather than position by position—the standard methodology in established derivatives markets. That evolution is appropriate as clearinghouses build depth and participants become more sophisticated; it isn’t critical today. Full collateralization remains the right baseline for now. The cross-collateral pathway is what makes the longer horizon evolution possible.

4. The insider trading line: misappropriation, not asymmetry

Some recent commentary, including a piece in Fortune by George Mason economist Robin Hanson, has argued that allowing insider trading on prediction markets is a feature rather than a bug, on the theory that insiders have information that makes prices accurate.

This conflates two different things. Informational asymmetry is intrinsic to all markets. Trading on superior analysis or research is what price discovery actually means. On the other hand, misappropriation of material nonpublic information from a position of trust is a categorically different practice. CEA section 4c(a)(1) draws this line in existing law.

The Commission’s recent enforcement action in CFTC v. Van Dyke validates that the statute reaches event contracts traded on CFTC-regulated venues without requiring new statutory authority. The Van Dyke record is also instructive on the operational side. The trader attempted to open an account on a KYC-rigorous DCM and was unable to. He successfully opened an account on a venue with weaker controls and traded there. The KYC standard is not theoretical.

The framework should focus enforcement on the source and exclusivity of the information, not on the size or confidence of the resulting position. That keeps informed trading (the activity that price discovery actually depends on) categorically distinct from misappropriation (the activity that erodes market integrity).

Why these four?

These four questions don’t exhaust what the CFTC has to decide. They aren’t the controversies that dominate press coverage. But they’re the operational details that determine whether event contracts become genuine institutional infrastructure or stall as a retail category outside traditional finance.

The destination is set, revealed by the comment record consensus. The path is what we’re building. These four questions are the load-bearing pieces of that path.

I made the case for all four in detail in my filed comment letter. Full submission is on the public docket: https://comments.cftc.gov/PublicComments/ViewComment.aspx?ID=115402&GUID=7b83fb49-b49e-40e9-a567-320097ccc469.

What 1,500 CFTC Comments Are Not Arguing About

The quiet consensus underneath the prediction market gambling debate.

As I dug into comment letters and commentary I realized that there were two distinct topics to cover here, so I’m splitting the review article. This one will focus on the overarching significance of the body of letters and the next one will discuss some specifics from my letter that I think are important technical considerations for the future of event contracts.

The CFTC closed comments on its prediction market rulemaking last Wednesday. Roughly 1,500 submissions hit the docket. Press digests are running this week and the framing will mostly be predictable: industry versus state attorneys general versus tribes versus consumer advocacy, with sports gambling as the loudest axis.

The press isn’t wrong. Those fights are real.

But sit with the comment record long enough and a different pattern emerges. Across roughly 1,500 submissions from radically different actors with incompatible commercial and political interests, there are questions almost nobody is arguing about. Those questions are what actually determine where event contracts go. Dustin Gouker‘s recent piece at Next Event Horizon covers the gambling-axis side sharply, so I won’t replicate that depth here. This issue is about what’s not being debated.

Seven archetypes in the comment record

Set aside the mass-mobilized form letters from Kalshi’s public comment campaign and the substantive comment record is probably a few hundred letters. They sort into seven recognizable archetypes.

Industry incumbents and aspirants. Prediction market operators like Kalshi and Polymarket, crypto-native venues like Coinbase and Hyperliquid, traditional incumbents like CME and Cboe. Common framing: function-based, principles-based, no new statutory authority needed. The CFTC already has the tools to oversee the category.

Sports leagues and players’ associations. The NFL, MLB, PGA, ATP, and the players’ unions filed both individually and through Elevate Government Affairs. Shared asks: 21+ age restrictions, deposit limits, integrity-focused information sharing, restrictions on contracts susceptible to manipulation. Gouker’s roundup linked above goes deep on this group.

State AG and tribal coalitions. The 38-state bipartisan amicus brief and the 60+ federally recognized tribes filing IGRA-grounded amicus. Their fight is jurisdictional rather than policy-substantive. They want this category back under state regulatory authority where they have leverage. They don’t have a positive program for what federal regulation should look like.

Senators’ letters. Merkley-led Democrats and others. Political messaging more than policy substance. Categorical prohibitions on death, war, terrorism, election outcomes. Insider trading guardrails.

Consumer advocacy and progressive NGOs. POGO, Better Markets, Public Citizen, and similar voices. Pushing categorical prohibitions and skeptical of industry self-regulation.

Academic and theoretical commenters. Robin Hanson and the libertarian-academic camp arguing for maximum permissiveness on the theory that even insider-driven prices are informative. A minority position but a vocal one. The comment record is where the academic-policy consensus on insider trading actually fractures.

Individual practitioners. Solo founders, traders, infrastructure builders without commercial axes to grind. A small slice of the comment record. That’s where my own filed comment sits.

What almost nobody is arguing about

Read these archetypes against each other and the unargued questions become visible.

Is the CFTC the right federal regulator for event contracts? Effectively yes. Industry argues for clean federal preemption. State AGs and tribes argue about which contracts should fall under CFTC authority, not against CFTC authority as a category. Senators arguing for prohibitions argue for the CFTC to enact them. The “should the SEC handle this” question that mattered two years ago has dissolved in the comment record.

Are event contracts derivatives, or misclassified gambling products? The substantive submissions overwhelmingly treat them as derivatives. The CFTC itself frames them that way. The “this is just gambling, full stop” framing lives in state AG amicus briefs and tribal IGRA challenges. Inside the comment record it’s a minority position.

Will event contracts become part of mainstream investing? Almost everyone assumes yes. Industry submissions argue for the framework that enables it. Consumer advocacy submissions argue for guardrails on the path. ETF issuers like Bitwise, Roundhill, and GraniteShares have already filed for event contract ETF products with the SEC. The destination is not being debated. The fight is about the shape of the path.

The fight, in other words, is about edges. Which contracts belong inside the perimeter. What manipulation safeguards apply. What KYC standards are required. How to handle insider trading. The destination, the regulator, and the category are largely settled.

What this means for the next article

What I focused on in my own filed comment letter was the operational detail that follows from accepting the consensus. Which contracts qualify for federal accommodation. How clearinghouse netting should work on cumulative event contract series. How cross-exchange collateral could let traditional finance infrastructure participate. How to draw the insider trading line precisely. Tomorrow’s issue digs into all four. This issue is about the ground the comment record shows we’re already standing on.

The destination, not the sideshow

The gambling debate will continue. It’s loud, the cultural framing is hardening, and the press will keep covering it because controversy reads. But the gambling debate is a sideshow. It determines edges, not destinations.

The destination, set by the consensus underneath the noise, is event contracts as a mainstream investing category. CFTC-regulated. Derivatives-classified. Distributed through ETFs and traditional brokerage channels. Subject to the design standards, surveillance, and investor protection apparatus that already govern the rest of the federal financial-market perimeter. That future is taken for granted in the comment record by everyone serious about the category, even when they disagree about which contracts make it there.

The question for the rest of us, traders and infrastructure builders alike, is whether we spend our energy on the sideshow or on the path.

Here’s my full letter: https://comments.cftc.gov/PublicComments/ViewComment.aspx?ID=115402&GUID=7b83fb49-b49e-40e9-a567-320097ccc469.

Batting 1.000 on a Baseball Prediction Market: A Field Report on Insider Trading

Not to brag, but I’m the greatest sports bettor of all time.

No, seriously. My win percentage is 100% (once you factor out a handful of human errors).

My secret? A system. A foolproof system (once you factor out a handful of human errors).

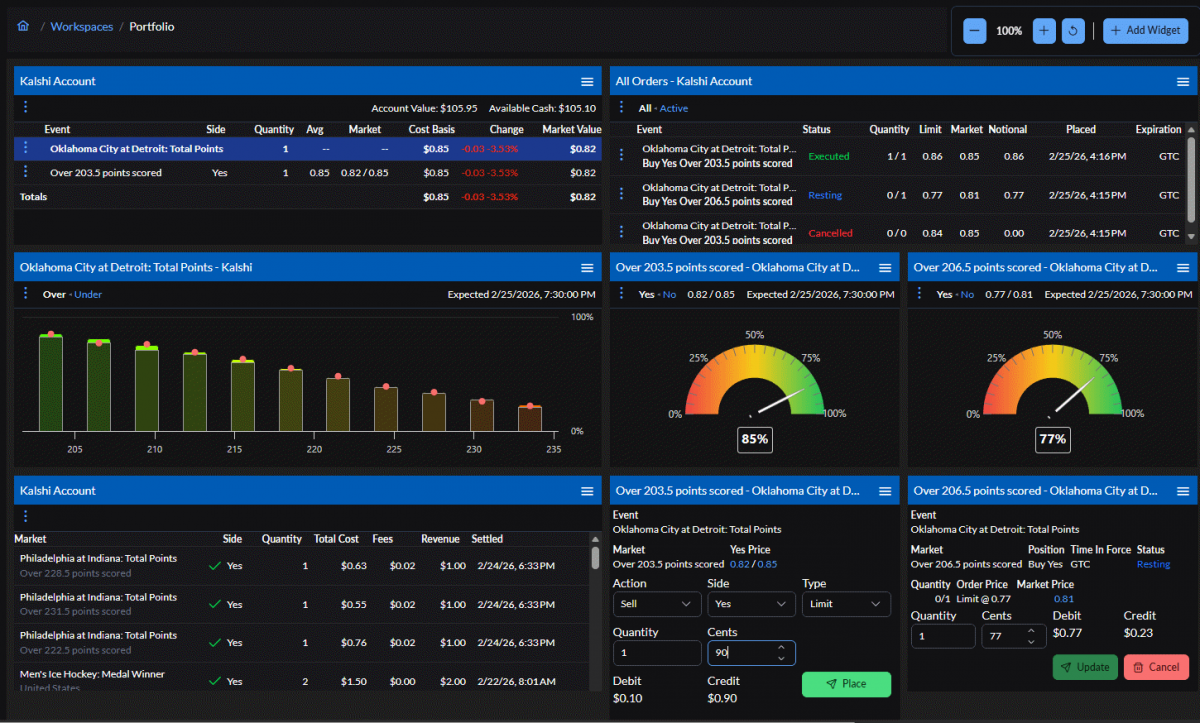
I only bet on sure things. When a batter is up in baseball, I stage a series of trade tickets in Qwidgets representing the potential outcomes of that at-bat. Then, after observing what happens, I place the trades for those outcomes. It’s foolproof (once you factor out a handful of human errors).

Quick disclosure: I’m not really a gambler. I did this at first to QA the mobile realtime trading experience of Qwidgets and found it made baseball games more engaging. While it’s neat to try to beat the automated systems to market, I could definitely see how people susceptible to gambling addiction could get into trouble very quickly. I don’t have an official stance on whether gambling should be allowed via prediction markets. I think it’s a net negative for society, but I also believe people should have certain liberties to make decisions for themselves. I’m not participating in that debate; I just want to build stuff.

Anyway, sportsbooks have rules against what I was doing. They call it “courtsiding” and it’s grounds to have your position voided. And, since it’s their money at risk as your counterparty, they’ll typically suspend betting in the periods immediately around these critical moments to keep users from exploiting latency.

Peer trading exchanges (like prediction markets) don’t work this way. They allow people to post bids and asks for contracts whenever they want, so it’s very easy to pick off offers someone forgot to withdraw. Or, in the case of certain incentive models, market makers will leave a single contract dangling at a competitive price to keep the market looking liquid for as long as possible.

And while event contracts aren’t really a thing yet in public financial markets (at least in the US), we do see a lot of event-centric activity, especially around earnings announcements. This drives a lot of racing to market as algos parse published announcements, generate updated views, and then aggressively trade outside market hours in the hopes of getting the exposure they now want at the best price possible.

This sort of event risk (effectively courtsiding) is an implicit risk in financial markets. There are reasonable regulatory protections against insider trading around these events, but even those are a little ambiguous. A case involving Texas Gulf Sulphur, for example, established an “absorption period” doctrine where parties with prior knowledge aren’t supposed to trade the instant a release hits in order to give time for outside parties to process the implications of the event. Modern instruments like 10b5-1 plans extend that principle—insiders pre-schedule trades in advance so they can’t time around news they’re not supposed to know yet. But in the modern world of automation and near-instant reaction, what does any of that really mean?

Practically speaking, ordinary investors are expected to be aware of and responsible for how they handle knowable market-moving events. In other words, they participate in a marketplace understanding that they’re not going to be able to compete in courtsiding event outcomes. Their investment vector necessarily has to be different from those who use superior automation to their advantage. Holding equity positions through events is an implicit acceptance of that risk.

Unfortunately, event contracts introduce two layers of increased risk not as prevalent in equities. First, it’s a lot harder to distinguish between insider trading and courtsiding. The legal framework for insider trading is built on duty plus non-public information. In event contracts, “information” is often just observation of a public event, and the speed of observation can produce profits that look like insider trading even when nobody breached anything. Second, courtsiding moments in event contracts are often terminal and result in all-or-nothing outcomes for holders that can happen at any time prior to expiration. The contract often resolves binary on the next pitch, with no “reassess next quarter”, no partial position, and currently no options market to hedge through. This substantially alters the nature of how investors approach hedging and monitoring.

While the event contracts themselves offer an immediate opportunity to hedge specific outcomes today, they’ll inevitably evolve into their own dedicated surface area. This will spur the need for specialized derivatives to hedge the event contracts themselves, such as the emerging class of ETFs based on event contracts (and the options to surely follow). And that hedging will be critical for everyone because legal courtsiding is effectively identical to illegal insider trading when binaries peg to 0 or 1 in an instant.

Quantcha Launches Qwidgets for Prediction Markets: Free Cross-Platform Analytics for an Emerging Asset Class

Quantcha launches Qwidgets for Prediction Markets, a free platform bringing cross-exchange analytics, integrated Kalshi trading, and portfolio modeling to the prediction markets space.

Quantcha, the options trading analytics platform that has served thousands of investors since 2014, today announced the launch of Qwidgets for Prediction Markets—a free platform that brings the analytical depth of professional options tools to the rapidly expanding prediction markets space.

Available now at https://predictions.qwidgets.com, Qwidgets for Prediction Markets aggregates real-time data from Kalshi, Polymarket, and other exchanges into a unified view, enabling investors to analyze, compare, and trade prediction market contracts with the same rigor they apply to options strategies.

“Prediction markets are the most important new financial instrument in a generation, but the tools haven’t caught up to the opportunity,” said Ed Kaim, Founder of Quantcha. “We’ve spent more than a decade building analytics tools for options traders. When I started analyzing prediction markets, I realized the same probability-assessment discipline applies directly—but the source of your edge is different. In options, you’re estimating whether time value and implied volatility are priced correctly. In prediction markets, you’re estimating whether the probability itself is correct. The analytical rigor is the same. The tools just didn’t exist yet. That’s what Qwidgets is.”

A Market Ready for Better Tools

Prediction markets have exploded in both volume and mainstream visibility. Kalshi, the only CFTC-regulated prediction market exchange, recently raised $1 billion at a $22 billion valuation. Polymarket processes over $20 billion in monthly trading volume. CNBC and CNN have signed partnership deals to broadcast prediction market data alongside traditional market tickers. The regulatory environment has shifted meaningfully, with the CFTC moving away from its earlier adversarial posture and federal policy appearing broadly supportive of prediction market development.

Yet despite this growth, the tools available to prediction market participants remain basic. The major exchanges offer simple charting and order entry, with no cross-platform comparison, no portfolio-level analytics, and limited analytical depth.

“This is where options markets were 15 years ago,” Kaim said. “The instruments are sound, the regulatory framework is solidifying, and institutional capital is arriving. What’s missing is the analytical layer. That’s exactly the gap Quantcha was built to fill for options, and it’s the gap Qwidgets fills for prediction markets.”

Key Features

  • Cross-Platform Data Aggregation: View and compare prediction market contracts from Kalshi, Polymarket, and other exchanges in a single, unified interface. Identify pricing discrepancies across platforms that would otherwise require monitoring multiple sites.
  • Integrated Kalshi Trading: Analyze and execute trades directly within Qwidgets. Research a contract, compare cross-platform pricing, and place an order without switching between applications.
  • Portfolio Modeling and Optimal Sizing: Express a model of relative likelihoods for outcomes within an event and generate optimized position sizing using frameworks like the Kelly criterion. Move beyond gut-feel sizing to mathematically disciplined allocation.
  • Shareable Workspaces: Create custom analysis workspaces and share them with anyone via a link. Recipients can view and modify the workspace locally without creating an account. Share a market analysis the same way you’d share a TradingView layout.
  • Free, No Restrictions: All features are available at no cost with no usage limits.

Built for Options Traders—and Everyone Else

Prediction markets price real-world events as probabilities, and the analytical skills options traders already have—probability assessment, sensitivity analysis, portfolio construction—transfer directly.

Qwidgets for Prediction Markets is designed to make those skills actionable. For options traders, it provides the familiar analytical depth in a new market. For prediction market participants coming from other backgrounds, it introduces the rigor and discipline of professional trading tools.

Accompanying Content Series

Alongside the platform launch, Quantcha is publishing an eight-part article series that explores the intersection of options trading and prediction markets:

The full series is available on Quantcha’s web site. Each article is designed for syndication across LinkedIn, Seeking Alpha, Substack, and financial media platforms.

The Case for Prediction Market Portfolio Theory

Apply Markowitz portfolio theory and Kelly criterion position sizing to prediction markets. Learn why correlation, diversification, and sizing discipline create edge.

Most prediction market participants are making the same mistake retail stock pickers made fifty years ago.

They find a contract they like—say, “Will the Fed cut rates in June?” trading at 35 cents—decide they think the probability is higher than that, and put money on it. Maybe they size the position based on how confident they feel. Maybe they size it based on how much cash is in their account. Then they find another contract they like and do the same thing again.

This is how prediction markets work for the vast majority of their hundreds of thousands of monthly active users. And it’s leaving enormous value on the table. Not because people are picking the wrong contracts, but because almost nobody is thinking about what happens when you hold more than one position at a time.

For background on prediction market mechanics: What Are Prediction Markets? A Guide for Investors. For how options analytics apply: What Options Greeks Can Teach Us About Prediction Markets

The Lesson Equity Investors Already Learned

In 1952, Harry Markowitz published “Portfolio Selection” in The Journal of Finance and changed how the world thinks about investing. His insight seems obvious in hindsight: the risk and return of a portfolio is not simply the sum of its individual parts. A collection of moderately risky assets can produce better risk-adjusted returns than any single asset, if you pay attention to how those assets relate to each other.

Before Markowitz, even sophisticated investors evaluated stocks one at a time. “Is this a good company? Is the price reasonable? Buy it.” Sound familiar?

It took decades for portfolio theory to filter down from academic journals to actual practice. Today, no serious equity investor would build a portfolio without considering correlation, diversification, and position sizing. But many prediction market participants, including those who would never dream of running a concentrated stock portfolio, routinely hold collections of contracts with no portfolio-level analysis at all.

The frameworks exist. The math is well-established. Nobody has bothered to apply them.

Correlation Is the Hidden Variable

Here’s a scenario. You believe the Republican candidate will win the next presidential election, so you buy that contract. You also believe Republicans will take the Senate, so you buy that. You think the House stays Republican too—another position. You’ve now taken three positions that feel like diversification across different prediction markets.

Except they aren’t diversified at all. Those three outcomes are heavily correlated. A political environment that produces a Republican presidential win is very likely to produce Republican congressional wins. Your “three positions” are functionally one big bet on the same underlying thesis. If you’re right, you win on all three. If you’re wrong, you lose on all three. You haven’t reduced risk—you’ve concentrated it while creating the illusion of diversification.

Now contrast that with a different portfolio: one position on the presidential election, one on whether the Fed will cut rates before year-end, and one on whether a major trade agreement will be ratified. These events are driven by fundamentally different dynamics. The Fed’s decision depends on inflation data and employment numbers. The trade agreement depends on diplomatic negotiations and legislative calendars. While there are second-order connections between politics and economic policy, the direct drivers of each outcome are largely independent.

This is where prediction markets have a structural advantage over many traditional asset classes. In equities, true decorrelation is hard to find. A financial crisis hits everything. A recession drags down even “diversified” portfolios. Prediction markets span genuinely independent domains—a Supreme Court ruling and an OPEC production target have no meaningful causal connection—though it’s worth noting that broad macro shocks can still create unexpected correlations across seemingly independent events. The opportunity for real diversification is better than almost anywhere else in financial markets, but only if you construct your portfolio with correlation in mind.

The Position Sizing Problem

Beyond correlation, there’s an even more fundamental issue: how much capital to allocate to each position.

Ask most prediction market participants why they put $500 on one contract and $200 on another, and you’ll get answers ranging from “I’m more confident in the first one” to “that’s what I had available.” This is gut-feel sizing, and it’s one of the fastest ways to erode returns even when your predictions are good.

The mathematical framework for optimal position sizing has existed since 1956, when John Kelly published his criterion for bet sizing at Bell Labs. The Kelly criterion tells you exactly how much to wager given two inputs: the odds being offered and your estimated edge.

Here’s a simplified version. Suppose a contract is trading at 60 cents—the market implies a 60% probability the event occurs. You’ve done your analysis and believe the true probability is 72%. Your edge is the difference between your estimate and the market price. Kelly says your optimal position size is:

f = (bp – q) / b

Where b is the net odds (what you gain per dollar risked), p is your estimated probability, and q is the probability you’re wrong. In this case, that works out to roughly 17% of your bankroll on the “yes” side.

Most participants would either bet too much (because they “feel confident”) or too little (because they’re scared of the downside). Kelly gives you the mathematically optimal allocation: the size that maximizes long-run geometric growth of your capital. Importantly, Kelly’s conservative nature helps you survive being occasionally wrong. By sizing positions relative to your actual edge rather than your emotional confidence, you avoid the catastrophic drawdowns that come from oversizing—which is how Kelly-disciplined participants stay in the game long enough for their analytical edge to compound.

In practice, most sophisticated bettors and traders use “fractional Kelly,” allocating a fraction (commonly half) of the Kelly-optimal amount. Full Kelly is mathematically optimal but emotionally brutal. Half-Kelly sacrifices a modest amount of long-run return for a significant reduction in drawdowns. This is the same tradeoff professional options traders make when they reduce position sizes below their model’s optimal recommendation.

The key insight isn’t the specific formula. It’s that position sizing should be a function of your estimated edge and the prevailing odds, not a function of your confidence level or your account balance. These are different things, and conflating them is expensive.

What a Portfolio Construction Framework Looks Like

Put correlation and position sizing together and you get something that looks remarkably like what equity portfolio managers and options traders do every day.

The process starts with identifying contracts where you believe you have an analytical edge—where the market-implied probability differs meaningfully from your own estimate. Not every contract qualifies. If a contract is trading at 70 cents and you think the true probability is 71%, that’s not a trade worth taking after transaction costs. Edge has to be material.

Next, you estimate the relationships between your candidate positions. Are any of them driven by the same underlying dynamics? A portfolio of five contracts that all depend on the outcome of the same election is a one-bet portfolio regardless of how many line items it has. You want positions whose outcomes are driven by independent information.

Then you size each position based on your estimated edge, adjusted for how it interacts with everything else in the portfolio. A contract with strong edge but high correlation to your existing positions gets a smaller allocation than the same edge on an uncorrelated event. This is the diversification benefit that Markowitz identified. You’re not just picking good individual positions, you’re constructing a portfolio where the whole is more efficient than the sum of its parts.

Finally, you monitor and rebalance. Prediction market prices move as new information arrives. An edge that existed yesterday may have closed today. A position that was uncorrelated with the rest of your portfolio may become correlated as events unfold. Imagine holding positions on both a presidential election and a policy outcome that becomes a major campaign issue. The relationships between positions aren’t static, and portfolio management is an ongoing process, not a one-time allocation.

None of this is new. Every step maps directly to established practice in equity and derivatives portfolio management. The only thing that’s new is applying it to prediction markets, and almost nobody is doing that yet.

With Qwidgets for Prediction Markets, you can already model relative likelihoods of outcomes within an event and generate optimized position sizing using approaches like Kelly criterion. Cross-event portfolio analytics—understanding correlation and constructing diversified portfolios across multiple events—is the natural next frontier and part of the Qwidgets roadmap.

Why This Edge Window Won’t Last

There’s a reason to think about this now rather than later.

Prediction markets are attracting serious institutional attention. Major trading firms are building dedicated desks. Exchange infrastructure is maturing. FIX protocol connectivity, margin trading, and API access are bringing prediction markets closer to the operational standards that institutional capital requires.

When institutional participants enter a market, they bring exactly this kind of portfolio-level discipline with them. They don’t size positions by feel. They don’t ignore correlation. They build portfolios, not collections of bets.

Today, the structural inefficiency in prediction markets isn’t primarily about information. Most of the events being traded are publicly observable, and the participants are often well-informed about the specific domains they’re trading. The inefficiency is about framework. Participants who bring quantitative portfolio construction to a market where most counterparties are sizing by instinct have a systematic edge.

That edge is a function of how few people are doing it. As more capital enters with more sophisticated approaches, the opportunity narrows. This is the same dynamic that played out in equity markets, in options markets, and in every other asset class that went from retail-dominated to institutionally-traded.

For what else the industry is building to support sophisticated traders: What Prediction Markets Still Need: An Options Trader’s Wishlist

The Shift in Thinking

The trajectory of prediction markets looks a lot like where options markets were fifteen years ago. The instruments are sound. The regulatory framework is solidifying. The exchange infrastructure is being built. What’s missing is the analytical layer: the tools, the frameworks, and the mental models that turn a collection of individual trades into a disciplined portfolio.

Portfolio theory isn’t complicated. Markowitz and Kelly published the core ideas decades ago, and they’ve been standard practice in traditional finance for just as long. The question isn’t whether these frameworks apply to prediction markets. They obviously do. Any asset class where you hold multiple positions with uncertain outcomes and varying correlations benefits from portfolio construction.

The question is how long it takes for the market to figure that out. And whether you’ll have adopted portfolio-level thinking before or after your counterparties do.

Model event probabilities and generate optimized position sizing. Qwidgets for Prediction Markets is free at predictions.qwidgets.com.

What Options Greeks Can Teach Us About Prediction Markets

Delta, gamma, theta, and implied volatility all have prediction market analogs. Learn the theta-vs-delta framework and build an analytical checklist that transfers from options.

If you’ve ever evaluated an options trade, you’ve used the Greeks—like delta, gamma, theta, and implied volatility (technically not a Greek, but everyone treats it like one). These metrics form the analytical language of options trading. They tell you how a position will behave as the underlying moves, time passes, and volatility shifts.

What most options traders don’t realize is that every one of these concepts has a direct analog in prediction markets. The math is simpler, the instruments are more transparent, and almost nobody in the prediction market world is applying these frameworks yet. That’s an edge, and understanding it starts with recognizing a fundamental difference in what you’re estimating.

For how binary contracts compare structurally to puts and calls: Binary Contracts vs. Puts and Calls

The Core Difference: Theta Estimation vs. Delta Estimation

Before mapping the individual Greeks, it’s worth framing the fundamental difference between where your edge comes from in options versus prediction markets.

In options, the primary edge for most strategies is theta estimation. Is the time value correct? Is implied volatility overstating or understating the realized move? Premium sellers profit when IV exceeds realized volatility. Directional traders profit when they identify mispricings in how the market prices time and uncertainty. The underlying stock price is observable, the question is whether the options on it are priced correctly.

In prediction markets, the primary edge is delta estimation. Is the market’s probability correct? There’s no time value to harvest in the options sense, no systematic volatility risk premium to capture. The question is simpler and harder at the same time: do you assess the probability of this event differently than the market does? If so, by how much, and are you right often enough to profit?

This distinction matters because it shapes which analytical habits transfer directly and which need to be adapted. The Greeks still provide a useful framework for understanding prediction market contracts, but the source of your edge is fundamentally different.

Delta: You Already Read Prediction Market Prices

In options, delta measures how much an option’s price changes for a $1 move in the underlying. But delta has a second, more intuitive interpretation: it approximates the probability that the option will expire in-the-money. A call with a delta of 0.65 implies roughly a 65% chance the underlying will be above the strike at expiration.

In prediction markets, delta isn’t an approximation, it’s the price itself. A contract trading at $0.65 is a 65% implied probability. There’s no pricing model to run, no assumptions about volatility or interest rates to feed in. The probability is right there on the screen.

This means every time you glance at an options chain and intuitively assess probability from the deltas, you’re already reading prediction market prices. The skill is identical. The prediction market just strips away the intermediate calculations.

Where this gets useful: options traders are trained to notice when delta “feels wrong.” When a strike’s implied probability doesn’t match your assessment of the underlying’s likely range. That same instinct applies directly to prediction markets. When a contract at $0.55 feels like it should be $0.70 based on your analysis of the event, you’ve identified the same kind of mispricing you’d exploit in an options chain.

Gamma: Sensitivity Near the Inflection Point

Gamma measures how quickly delta changes as the underlying moves. High-gamma positions are most sensitive near the strike price. This is the area where small moves in the underlying cause large swings in the option’s delta and value.

Prediction markets exhibit the same dynamic. A contract trading near $0.50—the market’s maximum uncertainty point—is the high-gamma zone. Small pieces of new information can push the price dramatically in either direction. A contract at $0.50 that gets a single favorable data point might jump to $0.65 in minutes. The same information hitting a contract already at $0.90 barely moves it.

Options traders understand this intuitively. You know that at-the-money options are the most sensitive and that deep in-the-money or out-of-the-money options are sluggish. The same logic applies to prediction market contracts: contracts near $0.50 are volatile and reactive; contracts near $0.00 or $1.00 are relatively stable.

The practical implication: if you want exposure to information-driven price swings, look for contracts in the $0.35–$0.65 range where gamma is highest. If you want more stable positions where your probability edge plays out gradually, look at contracts closer to the extremes. This is the same framework you’d use choosing between at-the-money and deep in/out-of-the-money options.

Theta: Time Decay Reimagined

In options, theta is the daily erosion of time value. It’s predictable, measurable, and central to income strategies. You can calculate exactly how much value an option will lose overnight, all else being equal.

Prediction markets have time decay, but it operates on a fundamentally different clock. Instead of calendar-driven decay, prediction market contracts experience information-driven convergence. The price converges toward $0.00 or $1.00 not because time is passing, but because new information is resolving uncertainty.

Consider a contract on whether the Fed will cut rates at the June meeting, currently trading at $0.40. Each piece of relevant data—a jobs report, an inflation reading, a Fed governor’s speech—pushes the price closer to its eventual settlement value. The contract doesn’t decay smoothly like an option. It jumps in response to information, with the magnitude of each jump increasing as the event approaches and the remaining uncertainty narrows.

This is where the theta-versus-delta distinction from earlier becomes concrete. In options, you can sell premium and harvest predictable daily decay because the market systematically overprices uncertainty (IV tends to exceed realized volatility). In prediction markets, there’s no analogous systematic overpricing. Contracts don’t embed a volatility risk premium that decays in your favor. Your return comes from assessing probability more accurately than the market—from being right about delta, not from harvesting theta.

For a worked example of how this plays out on a specific trade: The $100 Fed Rate Trade. For what this means for income-focused investors: Income Strategies in Prediction Markets: What Works Today and What’s Coming

Implied Volatility: The Metric Nobody’s Tracking

Implied volatility is arguably the most important number in options trading. It tells you whether the market is pricing in more or less uncertainty than usual. High IV means expensive premiums and nervous markets. Low IV means complacent markets and cheap options. Entire strategies like straddles, strangles, and iron condors are built around IV rather than directional views.

Prediction markets don’t have a standardized IV equivalent yet. Cumulative markets, where contracts exist at multiple thresholds on the same event, begin to bridge this gap. The prices across thresholds encode an implied distribution whose shape is a closer analog to implied volatility than anything a single binary contract can offer.

There is, however, and opportunity for inference when it comes to “implied uncertainty”. No platform publishes a rank or percentile for this, but the analog exists in the data.

Look at how much a contract’s price fluctuates over a given period relative to its distance from settlement. A contract at $0.50 that oscillates between $0.40 and $0.60 daily has high implied uncertainty because the market can’t make up its mind. A contract at $0.50 that holds steady at $0.48–0.52 has low implied uncertainty because the market has conviction even though the outcome is close to a coin flip.

Now compare two contracts on similar events. If one is swinging wildly and another is stable at a similar price, the volatile contract may be mispriced…or it may be responding to a genuine information environment where the outcome is harder to predict. This is the same analytical process options traders use when comparing IV across strikes or expiration dates.

The opportunity: because nobody is systematically tracking implied uncertainty in prediction markets, the traders who develop this intuition have an informational edge that doesn’t exist in options (where IV is displayed on every platform and priced in by every market maker). You’re applying a framework that’s standard in options to a market that hasn’t adopted it yet.

Putting the Greeks Together

In options trading, the Greeks don’t operate in isolation. A good options trader considers delta, gamma, theta, and IV simultaneously to build a complete picture of a position’s behavior. The same integrated thinking applies to prediction markets.

When you evaluate a prediction market contract, you’re asking:

  • Delta: What probability is the market implying, and does it match my assessment?
  • Gamma: How sensitive is this contract to new information? Am I comfortable with that volatility?
  • Theta: What’s the information calendar for this event? When are the data points that will drive convergence?
  • IV analog: Is this contract’s price volatility consistent with similar events, or is it unusually high or low?

This is exactly the mental model you already use for options. The only difference is that prediction markets make the probability dimension explicit (the price is the probability) while removing the modeling complexity (no Black-Scholes, no volatility surface, no dividend assumptions).

Beyond the Greeks: Analytics That Transfer Directly

The Greeks are the most recognizable analytical framework from options, but they’re not the only one. Several other tools in the options trader’s kit apply to prediction markets with minimal adaptation.

Bid-Ask Spread as a Signal

Options traders know that the bid-ask spread isn’t just a transaction cost, it’s information. A tight spread signals deep liquidity, active market making, and broad agreement on fair value. A wide spread signals thin liquidity, uncertainty about fair value, or a contract that institutional participants haven’t yet engaged with.

The same analysis applies in prediction markets, and it’s arguably more valuable here because liquidity varies dramatically across contracts. A Fed rate decision contract on Kalshi might have a one-cent spread, while a niche regulatory ruling might have a fifteen-cent spread. The tight-spread contract gives you confidence that the displayed price reflects genuine market consensus. The wide-spread contract is telling you either that the market hasn’t reached consensus or that liquidity providers don’t think there’s enough flow to justify tight quotes.

What to watch for: when a contract’s spread suddenly tightens, it often signals that informed participants are entering the market. When a spread widens after a period of being tight, it may signal that a major information event is imminent and market makers are pulling back. It’s the same behavior you see in options ahead of earnings announcements.

Cross-Contract Price Divergence

In options, you constantly compare prices across strikes, expirations, and underlyings. Is the 50-delta call expensive relative to the 25-delta? Is January vol cheap relative to February? Is SPY vol in line with QQQ vol given their historical relationship?

Prediction markets offer the same kind of relative value analysis. When Kalshi prices a Fed rate hold at $0.82 and Polymarket prices the same event at $0.77, that’s a five-cent divergence on identical outcomes. It could reflect different participant pools, different information processing, or a genuine arbitrage. Comparing the same event across platforms is the prediction market equivalent of checking the options chain across exchanges.

Within a single platform, look at contracts on related events. If the market prices a 70% chance the Fed holds rates and a 60% chance that inflation comes in above expectations, you should ask whether those two positions are internally consistent. An options trader would immediately recognize this as checking whether the volatility surface makes sense—and the same analytical habit creates edge in prediction markets.

The Information Calendar

Options traders live and die by the event calendar. Earnings dates, FOMC meetings, economic data releases—these create the rhythm of the market and determine when volatility will spike or collapse. You position around these events, not despite them.

Prediction markets have their own information calendars, and mapping them is just as important. For a contract on the next SCOTUS ruling, key information events might include oral arguments, conference dates, and historical patterns of when decisions are announced. For an OPEC production decision contract, the calendar includes preliminary meetings, member-state announcements, and geopolitical developments that influence negotiating positions.

The traders who map these information calendars have a structural advantage because they can anticipate when convergence will accelerate. If you know a key data release is coming Thursday, you know that a contract currently at $0.55 is likely to move significantly by Friday—similar to how an options trader knows that IV will crush after an earnings announcement. You can position accordingly: buying ahead of events where you have a view, or moving to the sidelines when the information event could go either way.

Volume and Open Interest Patterns

In options, a sudden spike in volume at a specific strike is a signal. It might mean institutional positioning, hedging activity, or someone expressing a directional view with size. Combined with open interest data, you can distinguish between new positions being opened and existing positions being closed.

Prediction markets offer similar signals, though the data is presented differently. A sudden increase in volume on a contract that’s been quiet often precedes a price move: someone with a strong view is building a position. On platforms like Kalshi, you can observe the order book depth directly, seeing where large resting orders create support and resistance levels. This is the prediction market equivalent of watching the options flow and identifying unusual activity before the rest of the market catches on.

Building Your Analytical Checklist

Bringing all of these tools together, here’s the analytical framework an options trader can apply to any prediction market contract:

  • Probability assessment (delta): Does the contract price match your independent probability estimate? If there’s a gap, is it large enough to trade?
  • Sensitivity analysis (gamma): Where is this contract on the $0.00–1.00 spectrum? Near $0.50 means high sensitivity to new information. Near the extremes means a more stable position.
  • Information calendar (theta analog): What events will drive this contract toward resolution? When are they? How much uncertainty will each event resolve?
  • Price stability (IV analog): How much has this contract’s price fluctuated recently? Is the volatility consistent with similar contracts, or is it unusually high or low?
  • Liquidity check (bid-ask): Is the spread tight enough to trade efficiently? Is the displayed price reliable, or is thin liquidity distorting it?
  • Relative value (cross-contract): Does this price make sense relative to related contracts? Are different platforms pricing the same event consistently?
  • Flow analysis (volume): Is there unusual activity on this contract? Are informed participants entering or exiting?

Every one of these questions is a direct translation of what you already do when evaluating an options trade. The difference is that in prediction markets, you can run this entire analysis without a pricing model, without a volatility surface, and without worrying about Greeks interactions. The simplicity is the feature.

For how to apply this thinking to portfolio construction and position sizing: The Case for Prediction Market Portfolio Theory

Why This Edge Is Temporary

The reason this framework is so valuable right now is that almost nobody in prediction markets is using it. The majority of participants are evaluating contracts in isolation, sizing by feel, and ignoring the analytical dimensions that options traders take for granted.

This is exactly where options markets were before analytical platforms like Quantcha and others made Greeks-based analysis accessible to retail traders. Before those tools existed, the traders who understood and applied the Greeks had a massive structural edge. The same dynamic exists in prediction markets today.

That edge will narrow as the market matures, as better analytics tools emerge, and as more analytically sophisticated participants enter. The window for significant returns from disciplined probability assessment—applying the delta-estimation rigor that options traders already practice—is open now. It won’t stay open forever.

Apply your options intuition to prediction markets with the right tools. Qwidgets for Prediction Markets is free at predictions.qwidgets.com.

Binary Contracts vs. Puts and Calls

How prediction market binary contracts compare to traditional options. Covers payoff structures, time decay, volatility, market types, and where each instrument wins.

If you trade options, prediction markets will feel simultaneously familiar and foreign. The core mechanics are recognizable: you’re trading contracts whose value is derived from an uncertain future outcome. But the structure, the payoffs, and the analytical toolkit differ in ways that matter.

This article walks through the structural comparison between prediction market binary contracts and traditional puts and calls, highlighting where the parallels hold and where they break down.

New to prediction markets? Start with: What Are Prediction Markets? A Guide for Investors. For why they’re not gambling: Are Prediction Markets Gambling? Why the Framing Is Backwards

The Structural Parallel

A prediction market contract is, at its core, a cash-settled binary option with a fixed $1 payout. You buy a “Yes” contract at the current market price—say $0.65—and receive $1.00 if the event occurs, or $0.00 if it doesn’t. The contract’s price represents the market’s implied probability of the outcome.

An important structural detail: every contract has a Yes and a No side whose prices sum to $1.00. Buying Yes at $0.65 is the same as selling No at $0.35. Options traders will recognize this immediately as analogous to put-call parity. It means you can express a bearish view on any event by buying No (or equivalently, selling Yes) just as easily as expressing a bullish view. The symmetry is complete.

Traditional options have the same foundational concept (a contract whose value depends on whether a future condition is met) but with significantly more complexity. A call gives you the right to buy at a strike price; a put gives you the right to sell. The payoff varies based on how far the underlying moves.

The simplest way to frame the difference: a prediction market contract asks “will this happen?” and pays a fixed amount if yes. An option asks “how much will this move?” and pays a variable amount depending on the answer.

Price as Probability

In prediction markets, the price is the probability. A contract at $0.72 means the market estimates a 72% chance the event occurs. This is transparent and immediate. No calculations required.

In options, probability is embedded but not directly visible. An option’s delta approximates the probability of expiring in-the-money: a call with a delta of 0.72 implies roughly a 72% chance the underlying will be above the strike at expiration. But delta is just one output of a pricing model that also accounts for time to expiration, implied volatility, interest rates, and dividends. The probability is there, but you have to extract it.

For a deeper dive into how each Greek maps to prediction markets: What Options Greeks Can Teach Us About Prediction Markets

Payoff Structures

This is where the two instruments diverge most sharply.

A prediction market binary contract has a fixed payoff. Buy at $0.40, event occurs, you make $0.60. Maximum gain and maximum loss are known at entry. There is no scenario where a winning trade pays more or less than the contract’s settlement value.

Traditional options have variable, potentially unlimited payoffs. A call bought for $2.00 could be worth $50 on a massive move. A put can protect an entire portfolio from a crash. The payoff scales with magnitude, which is what makes options so powerful for hedging and leverage.

The tradeoff: prediction markets offer simplicity and transparency at the cost of flexibility. Traditional options offer flexibility and leverage at the cost of complexity. Neither is inherently better—they serve different purposes.

It’s worth noting this may change. Both Kalshi and Polymarket have built support for scalar markets into their exchange architecture. These are contracts across a continuous range of outcomes rather than binary yes/no. Payoffs look like a vertical call spread. When scalar markets deploy broadly, prediction markets move closer to the variable-payoff structures options traders are accustomed to.

More on scalar markets and the industry roadmap: What Prediction Markets Still Need: An Options Trader’s Wishlist

Time Decay

Options traders live and breathe theta: the daily erosion of an option’s time value as expiration approaches. Theta is measurable, predictable, and central to dozens of trading strategies.

Prediction markets have time decay too, but it’s event-driven rather than calendar-driven. A contract on “Will the Fed cut rates at the June meeting?” doesn’t lose a predictable amount of value each day. Instead, its price responds to new information—economic data releases, Fed governor speeches, inflation reports—and converges toward $0.00 or $1.00 as the event approaches and uncertainty resolves.

In the final hours before an event, prediction market contracts often exhibit behavior similar to options near expiration: rapid price convergence, increased sensitivity to marginal information, and collapsing bid-ask spreads as the outcome becomes increasingly certain.

For options traders who profit from selling time premium, this difference matters. You can’t run a systematic theta-harvesting strategy in prediction markets because the decay isn’t calendar-predictable. But you can identify situations where the market is slow to incorporate new information, and that offers a different kind of edge with an arguably bigger impact in a less efficient market.

For what this means for income-focused investors: Income Strategies in Prediction Markets: What Works Today and What’s Coming

Prediction Event Types

Prediction markets are organized into different kinds of events. Each of these contains one or more related markets, and the nature of their relationship drives how you analyze and invest in them.

  • Single events are standalone and contain exactly one contract, such as “Will the Fed hold rates?” Yes or no.
  • Multiple events offer more than one independent market where zero or more will resolve to Yes, such as “Which Fed governors will dissent in the June meeting?”
  • Categorical events are a collection of mutually exclusive markets where exactly one will resolve to Yes, such as “Who will be confirmed as the next Fed chair?”
  • Range events are made up of mutually exclusive markets tied to numeric values or ranges, such as “What will the Fed rate be set to after the June meeting?”
  • Cumulative events offer markets at successive thresholds on the same event (“above 3%”, “above 4%”, “above 5%”), forming something like a strike chain that enables multi-leg strategies for investing in dynamic outcome ranges.
  • Spread markets compare two the difference in two measurements, such as the difference in team points in a sporting event. However, there are also some interesting opportunities in finance, such as investing in contracts that represent the difference in performance between two stocks like “Will MSFT stock outgrow AAPL stock by more than 100bps in 2026”, “…more than 200bps…”, etc., as well as the inverse outcomes where AAPL outperforms MSFT. This single concentrated market provides a significant investment benefit over traditional pair trading.

For options traders, cumulative markets are the most immediately interesting because they create the closest analog to a strike chain. Multiple-outcome events function like a basket of related contracts where probabilities constrain each other, similar to how option prices constrain each other through put-call parity and strike relationships.

For how cumulative thresholds enable income-style strategies: Income Strategies in Prediction Markets: What Works Today and What’s Coming

Volatility

Implied volatility is the language options traders use to assess whether contracts are cheap or expensive. Entire strategies are built around buying or selling volatility independent of directional views.

Prediction markets don’t have an implied volatility metric in the traditional sense. But they have an analog: the degree to which a contract’s price fluctuates relative to its distance from settlement. A contract at $0.50 that swings between $0.40 and $0.60 daily has high implied uncertainty. One that barely moves has low implied uncertainty.

This isn’t standardized the way IV is for options. No prediction market platform publishes an “implied uncertainty” metric. But options traders trained to look for these patterns can assess relative pricing efficiency across contracts using the same intuition.

It’s also important to note that there is an exception for IV around cumulative and range events. When you have contracts at ‘above 3%,’ ‘above 4%,’ and ‘above 5%’ on the same event, the prices across those thresholds implicitly define a probability distribution, and the width of that distribution is functionally implied volatility. The more thresholds available, the more closely this resembles backing out IV from an options strike chain. Since they can be used to infer a synthetic spot value, the other notable challenge remaining is accurate understanding of the time until expiration.

The Underlying Asset Question

Traditional options derive their value from an underlying asset you can separately trade. You can buy Apple stock and Apple options. This creates the foundation for hedging, covered positions, and delta management.

Prediction market contracts don’t have a separately tradeable underlying. You can’t “own” the Fed rate decision. Covered strategies don’t translate. You’re always trading the probability itself, never the event.

However, contracts on related events can function like multi-leg positions. Contracts on “Fed cuts by 25bp,” “Fed cuts by 50bp,” and “Fed holds” are mutually exclusive outcomes whose probabilities must sum to approximately 100%. If you’ve traded vertical spreads or butterflies, this structure will feel familiar and it enables similar relative-value opportunities.

Liquidity and Execution

Options on major underlyings have extraordinary liquidity with penny-wide spreads, massive open interest, and institutional market makers. This is the product of decades of maturation.

Prediction markets are earlier in that curve. High-profile events can have deep order books and tight spreads on Kalshi and Polymarket. Niche markets may have wide spreads and thin books. As institutional market makers continue to invest in dedicated prediction market desks, execution quality is improving steadily.

For options traders accustomed to reliable execution, this is the most immediate adjustment. Limit orders, patience, and book depth awareness matter more. The good news: your experience reading order books transfers directly.

Where Each Instrument Wins

Prediction markets are better when you have a specific view on whether a discrete event will occur and want the simplest, most capital-efficient way to express it. No Greek calculations, no strike selection, no expiration management. The return profile is transparent at entry.

Traditional options are better when you want leverage, variable payoffs, hedging capability, or multi-dimensional strategies around an underlying asset. Options give you far more strategic flexibility, but that flexibility comes with complexity.

They’re complementary, not competing. An investor who holds equity options positions and also trades prediction market contracts on Fed policy or regulatory outcomes is using each instrument for what it does best.

For a concrete example of how prediction markets can be more capital-efficient than options for event-driven views: The $100 Fed Rate Trade

The Analytical Gap—and the Opportunity

One of the biggest differences between options and prediction markets today isn’t structural—it’s the tools. Options traders have decades of platform development: Greeks dashboards, volatility surfaces, strategy analyzers, portfolio risk engines. Prediction markets have basic charting and order entry.

This gap is where the opportunity lies. The core skill that transfers from options to prediction markets isn’t strategy replication—it’s probability assessment discipline. In options, your edge comes from estimating theta accurately: is the time value (and the implied volatility embedded in it) over- or under-priced? In prediction markets, the edge comes from estimating delta accurately: is the market’s probability estimate correct? The analytical rigor is the same even if the target variable is different. Platforms like Qwidgets for Prediction Markets aggregate data across Kalshi and Polymarket, offer integrated Kalshi trading, and provide the kind of cross-platform analysis that options traders expect as baseline functionality.

If you’re an options trader, the probability-assessment skills you’ve spent years developing are more valuable in prediction markets than almost anywhere else in finance right now. The market is pricing contracts with limited tools, which means disciplined analytical approaches have significant impact.

Explore prediction markets with the analytical depth you’re used to from options. Qwidgets for Prediction Markets is free at predictions.qwidgets.com.

Are Prediction Markets Gambling? Why the Framing Is Backwards

Prediction markets aren’t gambling; they’re event-based derivatives. Learn why the framing matters, what the CFTC thinks, and how analytical investors gain edge.

The most common objection to prediction markets from serious investors is also the most understandable: “Isn’t this just gambling?”

It’s a fair question. But I’d argue the framing is exactly backwards—and that understanding why changes how you think about both prediction markets and the traditional instruments you already trade.

Start with What Gambling Actually Means

Gambling, in the financial sense, means taking risk with no analytical edge and no structural purpose. A slot machine is gambling. You have no information advantage, no strategy, and the expected value is negative by design.

Now think about what a prediction market contract actually is. It’s a financial instrument whose price reflects the market’s consensus probability of a real-world event. If you believe the market is mispricing that probability—because you have better information, a better analytical framework, or a more disciplined assessment—you can take a position. The structure is identical to any other financial market: informed participants identify mispricings and allocate capital accordingly.

This is investing, not gambling. The distinction has never been about the instrument, but about the participant’s edge and analytical process.

The Comparison Nobody Makes

Here’s what bothers me about the gambling framing: a huge amount of traditional securities trading is already event-driven speculation wrapped in the complexity of stocks and options.

When a trader buys out-of-the-money puts on bank stocks ahead of a Fed decision, they’re not making a nuanced assessment of that bank’s fundamentals. They’re using the bank stock as a vehicle to express an event-driven view and accepting all the noise, slippage, and unintended factor exposure that comes with it. When a portfolio manager repositions ahead of an earnings announcement, they’re speculating on an event outcome using an instrument that carries exposure to dozens of factors beyond that event.

A prediction market contract on the actual event is, arguably, the more transparent and honest financial instrument. The return is clear at entry. The risk is defined. There’s no unintended exposure to confuse the picture.

The typical framing is that prediction markets are gambling trying to be investing. I’d argue it’s the opposite: a significant portion of traditional securities trading is event-driven speculation trying to look like fundamental investing.

Prediction Markets Are Derivatives

Strip away the connotations and look at the structure. A prediction market contract derives its value from the outcome of a real-world event. That’s the literal definition of a derivative: a financial instrument whose value is derived from something else.

The difference between a prediction market derivative and a traditional derivative is directness. An option on Apple stock derives its value from Apple’s stock price, which is itself a proxy for the company’s future earnings, which are influenced by dozens of macro and micro factors. A prediction market contract on “Will the Fed cut rates in June?” derives its value directly from the event itself. No proxy. No intermediate variables. No unintended exposure.

This directness is the key innovation, and it’s what makes the gambling comparison so misleading. A slot machine gives you no information and a negative expected value. A prediction market gives you a transparent probability estimate, a defined risk/reward profile, and the ability to profit from superior analysis. These are fundamentally different activities.

The Sports Volume Objection

The most common evidence for the “it’s gambling” position is the volume breakdown. Sports contracts still represent a meaningful share of prediction market activity. Kalshi’s biggest single-day volume spikes often come from major sporting events.

But judging an asset class by its current volume mix is like judging the early internet by chat room traffic. The infrastructure matters more than the initial use case. And the infrastructure that prediction markets have built, including CFTC-regulated exchanges, institutional-grade APIs, FIX protocol connectivity, and margin trading, is designed for far more than sports.

The non-sports markets are growing fast. Economic events, political outcomes, regulatory decisions, and geopolitical milestones are all seeing increasing volume and liquidity. The exchanges are competing for institutional capital, and institutional capital doesn’t come for sports contracts—it comes for event-driven derivatives on economic and policy outcomes.

The Case for Sports Contracts

There is legitimate debate over whether sports contracts can be viewed as a valid investment vehicle. While most people look at them as traditional gambling, simple dismissal is short-sighted in the context of the positive purpose they serve. I’m not making a case here about whether sports betting should be universally legalized but rather using the example to reinforce the point that different participants have different investing needs.

For example, there are many traditional sports bookmakers who often need a way to hedge their books when positions become lopsided. This is the most traditional purpose for futures and options as they provide a way to balance delta risk. Enabling them to socialize that risk across willing investors via public exchange seems like a win for everyone.

Another example is a city with a team playing in a deciding playoff game. If their team wins, it will bring a significant economic benefit in the coming weeks. However, if the team loses, then they won’t enjoy the lift. Sports markets offer them a way to hedge the opportunity by investing in the outcome to ensure that they produce a net positive return no matter what the outcome is. Some would argue that betting against their own team is sacrilege while others believe the city’s fiscal responsibility is to produce the highest expected value for its citizens. Regardless of how a city ultimately decides to act, having the option is worthwhile.

What the Regulators Think

The regulatory trajectory tells you a lot about whether the people who oversee financial markets view prediction markets as gambling.

The CFTC—which regulates derivatives, not gambling—has moved away from its earlier adversarial posture toward prediction markets. Kalshi operates as a CFTC-regulated designated contract market, the same regulatory status as the CME and CBOE. Polymarket recently received CFTC approval for U.S. operations. The regulatory framework treats prediction market contracts as event-based derivatives, not wagers.

Federal policy appears broadly supportive of prediction market development, even as state-level regulatory questions remain. The direction of travel is toward integration with the broader derivatives ecosystem, though the pace and specifics will continue to evolve.

This matters because the regulatory classification reflects a substantive judgment about the nature of the instrument. The CFTC doesn’t regulate casinos. It regulates financial markets. And it has determined that prediction markets belong in the latter category.

Why This Matters for Your Analysis

The gambling framing isn’t just wrong—it’s actively harmful to clear thinking about prediction markets as investment instruments.

If you approach prediction markets as gambling, you treat each contract as an isolated bet, you size by feel, and you don’t think about how your positions relate to each other. This is exactly how many prediction market participants behave today and is why analytically disciplined investors have such a large structural edge.

For how to apply portfolio discipline to prediction markets: The Case for Prediction Market Portfolio Theory

If you approach prediction markets as what they actually are (event-based derivatives with transparent probability pricing) you bring the same analytical rigor you’d bring to any other financial instrument. You assess the market’s implied probability. You compare it to your own estimate. You size the position based on your edge, not your emotion. You think about correlation across your portfolio. You use proper tools.

For how options analytics map to prediction markets: What Options Greeks Can Teach Us About Prediction Markets

That shift in framing from “gambling” to “event-based derivative” is the single most important conceptual upgrade an investor can make when approaching prediction markets. Everything else follows from it.

Explore prediction markets with the analytical depth they deserve. Qwidgets for Prediction Markets is free at predictions.qwidgets.com.

Income Strategies in Prediction Markets: What Works Today and What’s Coming

Can you run theta-decay and premium-selling strategies in prediction markets? An honest assessment of what works, what doesn’t, and what infrastructure changes are coming.

A huge portion of retail options volume isn’t about directional speculation. It’s about income. Selling covered calls, writing cash-secured puts, running the wheel, deploying iron condors and credit spreads rolled weekly. These strategies share a common foundation: they harvest premium from time decay and implied volatility, producing relatively steady income in exchange for defined risk.

If you run income strategies in options, you’ve probably looked at prediction markets and asked the obvious question: can I do this here?

The honest answer is nuanced. Some elements of premium-selling and income generation translate to prediction markets today. Others don’t, and won’t until the market’s infrastructure catches up. This article walks through what works, what partially works, and what needs to change before prediction markets can fully serve income-focused investors.

For background on how prediction market contracts compare structurally to options: Binary Contracts vs. Puts and Calls

The Theta-vs-Delta Distinction

Before getting into specific strategies, it’s worth understanding the fundamental difference between where income comes from in options versus prediction markets.

In options, income strategies work because of theta—systematic time decay. Implied volatility tends to overstate realized volatility (the volatility risk premium), so premium sellers capture the spread between what the market charges for uncertainty and what actually materializes. You’re getting paid because the market systematically overprices insurance against uncertainty.

Prediction markets have no analogous volatility risk premium. There’s no systematic overpricing of uncertainty that you can harvest by being a seller. Instead, your return comes from delta estimation—from assessing probability more accurately than the market. You’re not getting paid for the passage of time. You’re getting paid for being right about what’s going to happen.

This distinction shapes everything that follows. Strategies that depend on systematic theta decay don’t translate. Strategies that depend on superior probability assessment do—and prediction markets offer some structural advantages for that kind of edge.

Why Theta Strategies Don’t Translate Directly

Let’s start with what makes options income strategies work, because understanding the mechanics is what reveals where prediction markets fall short.

When you sell a weekly out-of-the-money put on SPY, several things are working in your favor. First, theta: the option loses time value every day regardless of what happens in the market. You’re getting paid for the passage of time itself. Second, a persistent underlying: SPY keeps trading after this week’s expiration, and next week you can sell another put. Third, the recovery mechanism: if SPY drops and your put goes in-the-money, you can roll it out in time (and possibly down in strike), collecting additional premium with each roll while waiting for the underlying to recover. Time is on your side because the underlying is persistent and has historically trended upward.

Prediction markets lack all three of these structural elements.

There is no systematic calendar-driven time decay. A prediction market contract’s price moves on information, not the clock. It might sit unchanged for days, then jump 10 cents on a single data release. You can’t harvest predictable daily decay because there isn’t any.

There is no persistent underlying. Each contract is tied to a discrete event with a single resolution point. “Will the Fed hold rates in June?” resolves once, and then the contract ceases to exist. There’s no equivalent of SPY continuing to trade the next day.

And critically, there is no recovery mechanism. If you buy a contract at $0.90 expecting the event to resolve in your favor and adverse information drops it to $0.60, you can’t roll the position out to a later date on the same event. The event happens when it happens. You either take the loss or hold to settlement hoping for a reversal, but there’s no structural mechanism generating new premium to offset your drawdown.

This is the fundamental gap. The wheel strategy, the rolling put program, the systematic premium-selling portfolio: they all depend on a continuous cycle of expiration, collection, and renewal on the same underlying. Prediction markets don’t have that cycle today.

For more on how time decay works differently in prediction markets: What Options Greeks Can Teach Us About Prediction Markets

What Works Today

That said, prediction markets aren’t a dead end for investors who think in terms of premium and probability. Several approaches produce return profiles that share characteristics with income strategies, even if the underlying mechanics differ. The key shift is from harvesting theta to estimating delta more accurately than the market.

Buying High-Probability Contracts Near Resolution

The closest analog to selling OTM puts is buying contracts on outcomes you consider near-certain as they approach settlement. If a Fed rate hold contract is trading at $0.92 with two weeks until the FOMC meeting and you’re highly confident the Fed will hold, buying at $0.92 to collect $1.00 at settlement produces an 8.7% return over two weeks.

The risk profile is similar to a short put: frequent small wins, with occasional large losses when the “sure thing” doesn’t happen. You’re essentially short tail risk. The math works as long as your probability estimates are better than the market’s and you size your positions appropriately.

The key difference from selling puts is what happens when you’re wrong. If the trade goes against you, there’s no rolling, no recovery, no additional premium to collect while you wait. You take the loss and move on to the next opportunity. This makes position sizing even more important than in options, where the rolling mechanism gives you a second (and third, and fourth) chance.

For the math on position sizing with Kelly criterion: The Case for Prediction Market Portfolio Theory

Selling Low-Probability Outcomes

The mirror image: selling “Yes” contracts on outcomes you believe are extremely unlikely (or equivalently, buying “No” contracts at high prices). If a contract asks “Will the Fed cut 100bps at the next meeting?” and “No” is trading at $0.97, buying it produces a 3% return when the contract settles as expected.

This is structurally identical to selling deep OTM options. You collect a small premium in exchange for bearing low-probability, high-impact risk. You could build a portfolio of these across many events, and the diversification across independent outcomes is the prediction market version of selling premium across different underlyings and expirations.

The returns per position are modest, but across a diversified book of 20 or 30 positions on uncorrelated events, the aggregate return can be meaningful. And because prediction market events span genuinely independent domains (a Fed decision and a Supreme Court ruling have no causal connection), the diversification potential is actually better than selling puts across stocks that all correlate in a drawdown.

Exploiting Slow Information Incorporation

In options, selling premium works partly because implied volatility tends to overstate realized volatility. The market systematically overprices uncertainty, and premium sellers capture that spread.

Prediction markets have their own version of this: prices that are slow to incorporate publicly available information. When a Fed governor gives a speech that heavily signals the next decision, the prediction market contract might take hours or days to fully adjust. If you process information faster than the market, you can capture the convergence, which produces a return that looks like premium collection even though the mechanism is different.

This is arguably a bigger opportunity in prediction markets than in options because the participant base is less analytically sophisticated. In options, the premium seller is competing against institutional market makers with PhDs in quantitative finance. In prediction markets, the analytical bar is lower, and the edge available to a disciplined participant is correspondingly larger.

The Fee and Carry Math

Any income strategy lives and dies by its cost structure, and prediction markets have a non-obvious fee dynamic that matters.

Kalshi uses a quadratic fee curve: fees are highest on contracts near $0.50 (where uncertainty is greatest) and taper toward the extremes. This has a direct impact on strategy selection. The high-probability contracts that income-focused investors gravitate toward (prices near $0.90 or above $0.95) carry lower fees than contracts in the middle of the range. This is actually favorable for premium-style strategies because the fees are smallest precisely where income investors are most active.

On the other side of the ledger, Kalshi offers 3.5% APY on deposited funds and open positions. This meaningfully offsets the opportunity cost of capital sitting in your prediction market account. If you’re earning 3.5% on deposits while your contracts are open, the effective cost of tying up capital is much lower than it would be in a brokerage account where idle cash earns nothing or near-nothing.

The net effect: for strategies focused on the extremes of the price range (high-probability buys and low-probability sells), the fee structure is manageable and the carry yield helps. For strategies that require frequent trading near $0.50, the fees can eat a significant portion of your expected edge. Income investors should skew toward the extremes, which is where the natural analogs to premium selling live anyway.

For how capital efficiency compares between prediction markets and traditional instruments: The $100 Fed Rate Trade

Cumulative Thresholds: A Partial Bridge

Where things start to get more interesting for income investors is with cumulative threshold markets. These are contracts like “Fed funds rate above 3%,” “above 4%,” and “above 5%” on the same event. Each threshold is a different strike on the same underlying, and taken together they form a de facto strike chain.

This opens up strategies that feel much more like options income trading.

Vertical Spreads

Buy Yes on “above 4%” at $0.65 and buy No on “above 5%” at $0.80 (the same as selling Yes at $0.20). Since rates must either be above 4% or not above 5% (or both), at least one position always pays $1.00. You’ve constructed a bull call spread equivalent for $1.45 where the floor payout is $1.00 and the ceiling is $2.00 if rates land between 4% and 5%. Max gain $0.55, max loss $0.45. The payoff is defined, the risk is bounded, and you can choose your risk/reward by adjusting which thresholds you trade.

Selling the Tails

Buy No on “above 5%” at $0.70 (the same as selling Yes at $0.30) and buy Yes on “below 3%” at $0.15. You’ve built an iron condor analog for $0.85. If rates land anywhere between 3% and 5%, both positions pay out for a total of $2.00 and a gain of $1.15. If rates move to either extreme, one position still pays $1.00, capping the max loss at $0.15 since you always have one winner. The income profile resembles the iron condors that options income traders are comfortable with.

Staggered Expirations

If these cumulative thresholds exist for the next three FOMC meetings, you have something closer to a real expiration cycle. You can sell the tails across all three dates, and as each meeting passes and settles in your favor, you free up capital and realize gains while the later meetings are still outstanding. The cash flow pattern is similar to rolling premium: regular realization punctuated by occasional losses when the market moves against you.

The key limitation is that each meeting is still an independent event. You’re not rolling the same position, you’re building a portfolio of related but independent trades. If the macro environment shifts and the Fed changes course, all your positions may correlate against you simultaneously. Unlike rolling a put on a stock that can recover, a Fed decision that goes against you is final for that settlement date.

What Needs to Change

For prediction markets to genuinely serve income-focused investors, two things need to happen.

Scalar Markets

The biggest unlock is the deployment of scalar markets at scale. Instead of binary “yes or no” contracts, scalar markets ask “what will the value be?” across a continuous range of outcomes. A scalar prediction market on the S&P 500 year-end level would create a probability distribution across outcome ranges, something that looks remarkably like an options chain with direct probability pricing.

With scalar markets, you could sell contracts at strikes you consider unlikely (equivalent to selling OTM options), build defined-risk spreads across the full range, and generate the kind of income profile that premium sellers are looking for. Scalar market types already appear in exchange APIs, signaling clear directional intent even if the timeline for full deployment remains uncertain.

For more on scalar markets and the industry roadmap: What Prediction Markets Still Need: An Options Trader’s Wishlist

Rolling Expirations on Persistent Themes

The second requirement is rolling expirations on the same underlying theme. If Kalshi offered monthly scalar contracts on the Fed funds rate, each with a full set of thresholds, you’d have the complete structure: a strike chain, a term structure, and the ability to roll positions from one expiration to the next. That’s the prediction market equivalent of the SPX options chain, and it’s what makes systematic income strategies possible.

This is the moment when the wheel strategy, the rolling put program, and the systematic condor portfolio become feasible in prediction markets. It’s also the moment when the recovery mechanism works: if a position goes against you in the current month, you can roll it to the next month while the underlying theme (where rates will be) continues to evolve. Time becomes your ally again.

This isn’t speculative. The trajectory of exchange development points clearly in this direction. Recurring economic events like monthly inflation readings, quarterly GDP reports, and regular Fed meetings are natural candidates for rolling contract series. The institutional demand for these products is strong, and the exchanges are competing for exactly this kind of sophisticated volume.

The Honest Assessment

If you run income strategies built on selling premium and rolling positions, prediction markets can’t fully replicate that today. The instruments are too discrete and too terminal. The continuous cycle of expiration, collection, and renewal that makes theta harvesting work in options doesn’t exist yet.

But “not yet” is the key qualifier. Here’s what you can do right now:

  • Build analytical fluency. The probability assessment and sensitivity analysis skills that make you a good premium seller in options are exactly the skills that create edge in prediction markets. The difference is that your edge comes from better delta estimation rather than theta harvesting. Start applying that discipline now while the market is less competitive.
  • Capture income-like returns on high-conviction positions near resolution. The return profile resembles premium selling even though the mechanism is different, and the available returns can be attractive relative to the risk.
  • Use cumulative thresholds to build spread and condor-like structures where they’re available. These are partial solutions, but they’re real and tradeable today.
  • Size positions rigorously. Without the rolling recovery mechanism, getting sizing right is even more critical than in options. Kelly criterion or fractional Kelly should be your starting point, not your gut.
  • Diversify across independent events. This is where prediction markets have a genuine structural advantage. A portfolio of income-like positions across genuinely uncorrelated events (Fed policy, Supreme Court rulings, trade agreements, regulatory outcomes) provides diversification that’s hard to achieve in equities, where everything correlates in a crisis.

And here’s what’s coming: scalar markets and rolling expirations that will make the full income strategy playbook viable. The infrastructure is being built. The exchanges are investing heavily. The timeline is measured in quarters, not years.

The investors who build their prediction market analytical framework now will be positioned to deploy income strategies as soon as the infrastructure supports them. The ones who wait for the infrastructure to be perfect before looking at prediction markets will find that the early movers have already captured the largest edge.

Start building your prediction market analytical toolkit. Qwidgets for Prediction Markets is free at predictions.qwidgets.com.