Quantcha Options Suite
Stock & Option Charting
Turning data into knowledge so you can turn insights into trades.
- Plot a variety of key option data points to easily discover outliers
- Model technical trading positions one chart click at a time
- Stock charting that satisfies seasoned technical analysts
01
Plot key option data points to discover outliers
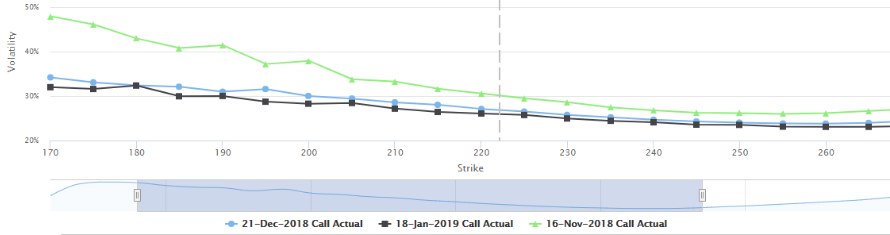
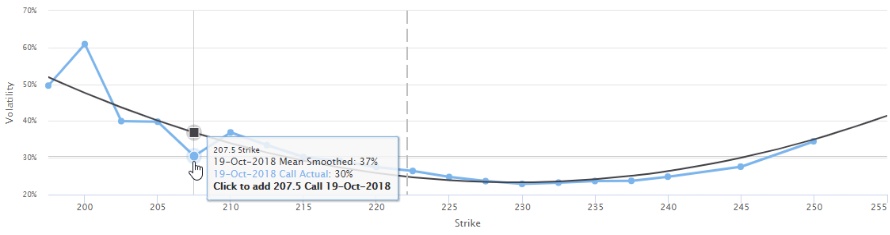
Plot a variety of option properties—such as Greeks, bid/ask mean, and more—across multiple expirations for puts and calls. Include smoothed fitted curves for key properties like implied volatility to see which options are trading rich vs. cheap.
02
Model technical trading positions one chart click at a time
When you identify an opportunity in a chart, click the data point to add its underlying option to a working book. Once you've assembled a set of options and quantities that meet your goals, send them to the book manager for further review—or straight to a trade ticket.
03
Stock charting that satisfies seasoned technical analysts
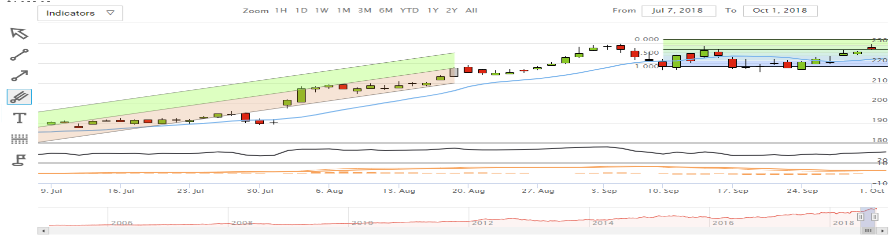
Whether working with historical daily quotes or up-to-the-minute bars from the past week, you'll have the tools to zero in on a view for optionable stocks—with flexible support for a wide variety of technical indicators, plus drawing and highlighting features.
Resources