Option investors thrive by selling rich options and buying cheap ones, but telling them apart is tougher than you might think.
To help make the process easier, Quantcha provides a variety of charting options that enable you to visualize options across a multitude of axes.
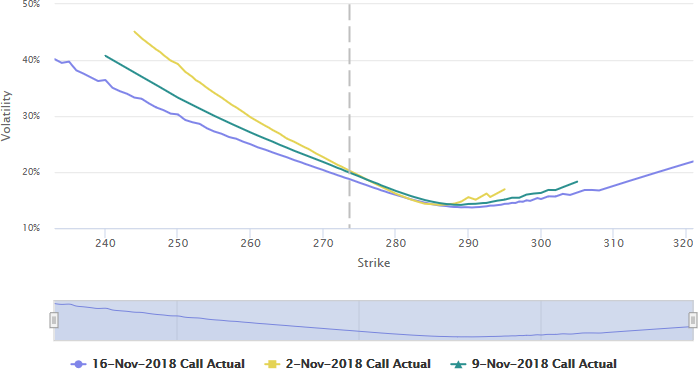
At the highest level, this enables you to identify patterns that hint at market sentiment. For example, the volatility skew often provides insight as to bullish or bearish sentiment. For any chart, you can add the actual call and/or put values across any combination of expirations.
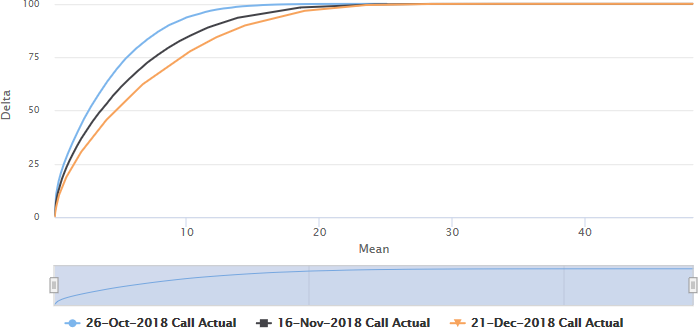
In addition to traditional charts like implied volatility by strike, you can plot a variety of option properties against each other. For example, you can see the relative price for directional exposure when plotting delta by bid/ask mean. You can then take it a step further to actually find and act on these opportunities.
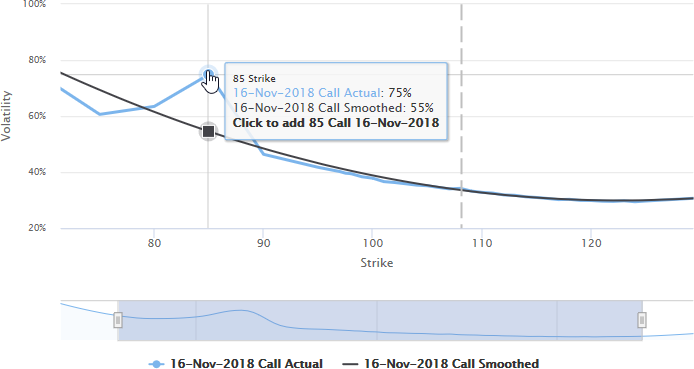
When plotting certain properties, such as implied volatility against strike, you can include smoothed curves. These curves represents the best fit for the options based on the assumption that they should fall along a parameterized function. If you trade against this market theory, then you’ll consider options with volatility noticeably above the curve to be rich while those below it to be cheap. You can then trade these options to generate profit when their volatilities normalize along the curve. When traded in combinations, you can effectively hedge out other pricing factors. To make it even easier to construct sophisticated trades, you can simply click a point in the chart to add that option to a pending book.
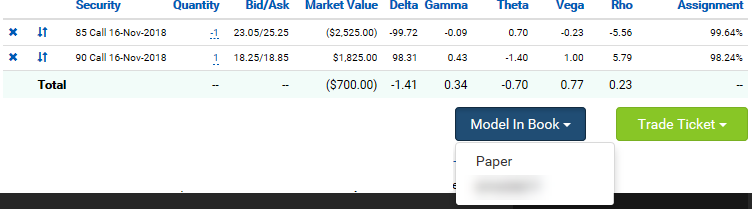
The pending chart book for a given underlying will stay with you across different charts. This means you can pick and choose opportunities from different views and edit the side and quantity without leaving the view. When you’re ready, you can model them against your current holdings, or send them directly to a trade ticket.