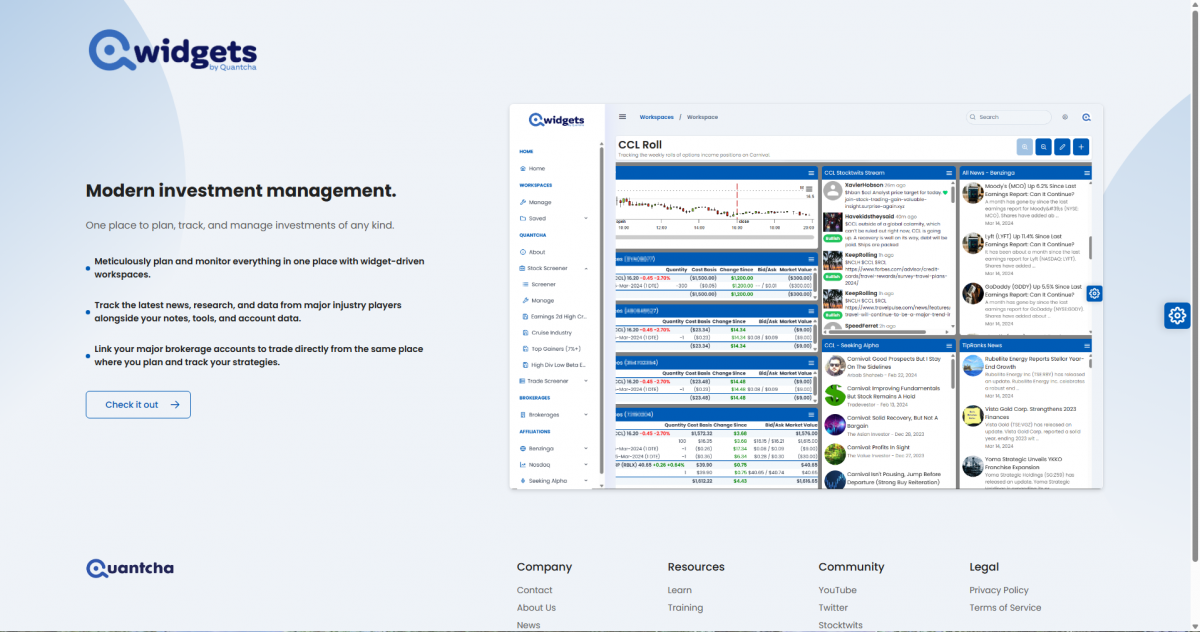
Quantcha, the options trading analytics platform that has served thousands of investors since 2014, today announced the public beta of Consequitur—a free tool that lets anyone map how real-world events move each other and model what a shift in one event does to the probabilities of the others.
The beta is available now at consequitur.com. No account or signup is required to explore the graph, set your own estimates, or run what-if scenarios.
Prediction markets already price levels—the probability that any single event resolves YES—continuously and in public. What no market shows you is the conditionals: how much one event’s probability should move when another resolves. That gap is what Consequitur is built to work in. Every event arrives with a live AI baseline, informed by market prices where a market exists—Kalshi, Polymarket, and more—and every link between two events carries a starting estimate of how strongly one bears on the other. Where you disagree, you set your own. Then you run the what-if: hold an event at YES or NO and watch the implied probabilities ripple across everything connected to it.
“Markets have gotten remarkably good at pricing whether any single event happens,” said Ed Kaim, Founder of Quantcha. “What nothing prices is how events move each other. If the ceasefire collapses, what happens to oil? If oil spikes, what does the next inflation print look like? If inflation surprises, what does the Fed do? Every desk carries a mental model of that cascade, but it lives in heads and hallway conversations—there’s nowhere to put real numbers on it and see what it implies. In options, your edge comes from estimating whether implied volatility is priced correctly. In prediction markets, it comes from estimating whether the probability itself is correct. Consequitur extends that one more step: estimating whether the relationship between two probabilities is correct—then showing what that implies for every connected event. Map enough of those relationships across a book of positions and you have a sensitivity layer for event exposure—the role a risk book plays on a trading desk, but over events instead of prices. That’s the direction we’re building toward.”
A Maturing Market’s Unpriced Layer
Prediction markets have scaled from niche curiosity to mainstream financial instruments, with regulated exchanges, institutional market makers, and broadcast partnerships putting implied probabilities in front of millions of investors. The analytical layer on top of those markets is maturing quickly—but it is almost entirely within-market: charting, order books, and portfolio tools for contracts the exchanges already list. The structure connecting those contracts—how a move in one event reprices the next—is something no tool has let an individual work with directly.
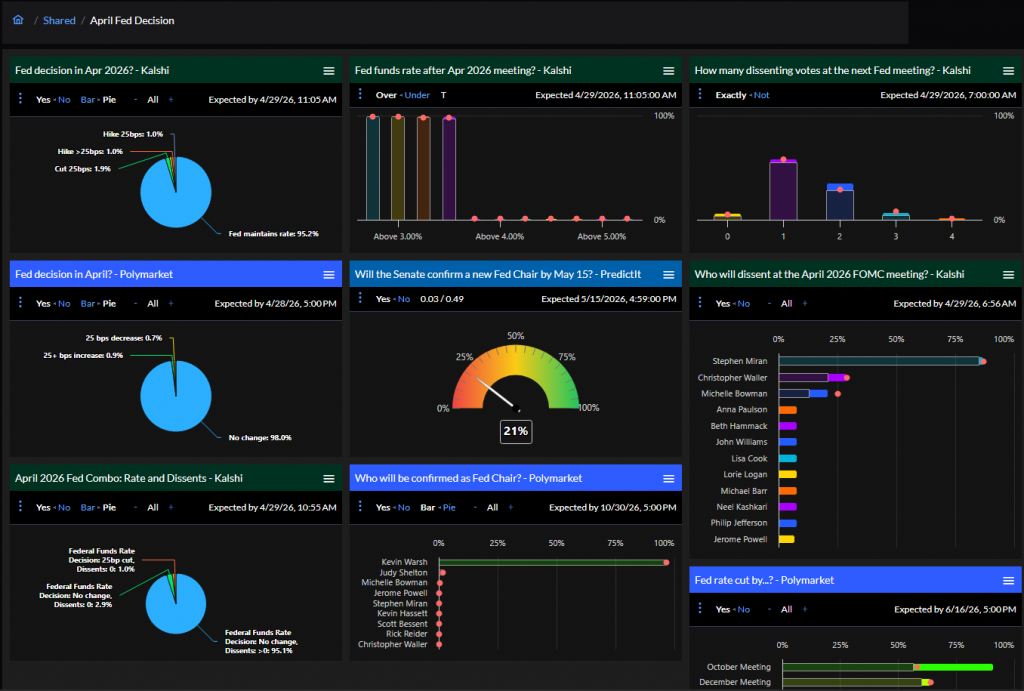
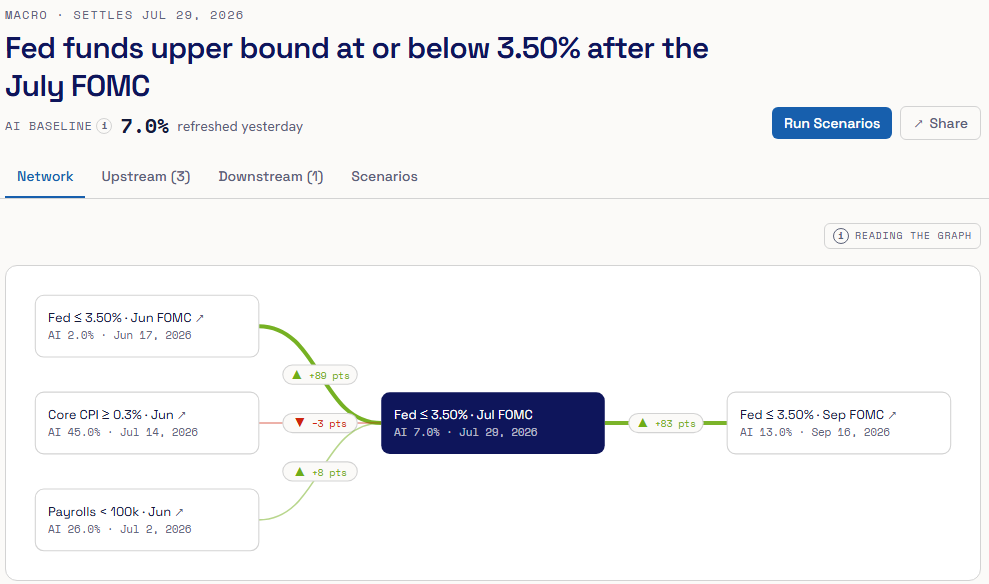
The beta launches with a single anchor graph built on the question most likely to move every other market this year: does the Fed deliver at least one rate cut in 2026? The graph spans 21 events and 22 dependencies covering inflation prints, labor data, energy and geopolitics—including the ceasefire-to-oil-to-inflation-to-Fed transmission chain—and cross-domain catalysts.
Key Features
- The Event Graph, with Live AI Baselines: A directed graph of real-world events where each node carries a live AI probability baseline, informed by market prices where a market exists—Kalshi, Polymarket, and more. It’s the starting point you adjust, not a fixed answer.
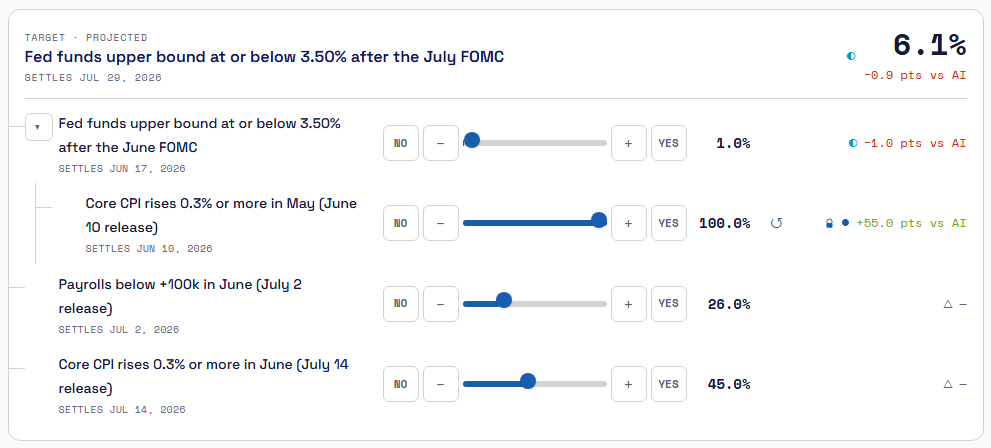
- Your Own Estimates: Set your own view on any link between events—no account, no signup. Each estimate is recorded as the shift it implies against the baseline, so it keeps working as the underlying markets move.
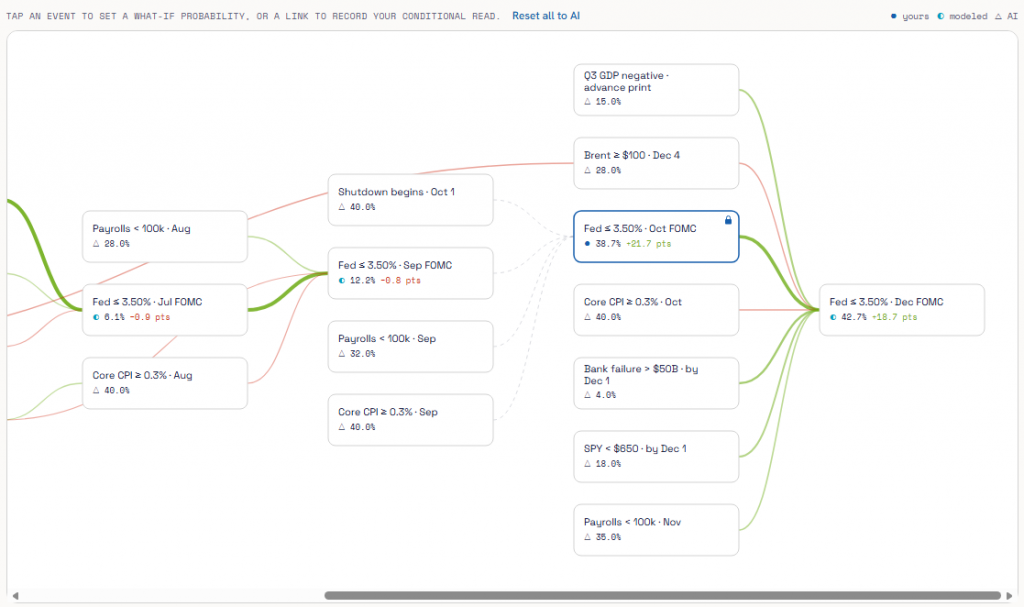
- What-If Scenarios: Hold one or more events at YES or NO and watch the implied probabilities of every connected event move in real time.
- Open Methodology: A live methodology page documents the model in the open; review the in-depth technical whitepaper.
- Free and Link-Shareable: Every graph view and scenario travels via URL. Share a what-if the way you’d share a chart layout—no paywall, no gating.
The Roadmap
The public beta is deliberately scoped: one anchor graph, free, no signup. The roadmap is where the larger thesis lives. Structurally, the graph is a sensitivity surface for a book of event-contract positions—the event-space counterpart of the risk book a trading desk keeps, mapping what moves a position and by how much across events rather than prices. In the domains where no price process exists to derive such a thing—politics, policy, geopolitics—there is today no established way to compute one at all. Nearer term, the roadmap adds further anchor graphs and synthetic market discovery: inferring implied probabilities for events no exchange currently lists from the conditional structure around them. All of this is future work; what is live today is the Fed graph, your own estimates, and what-if Scenarios.
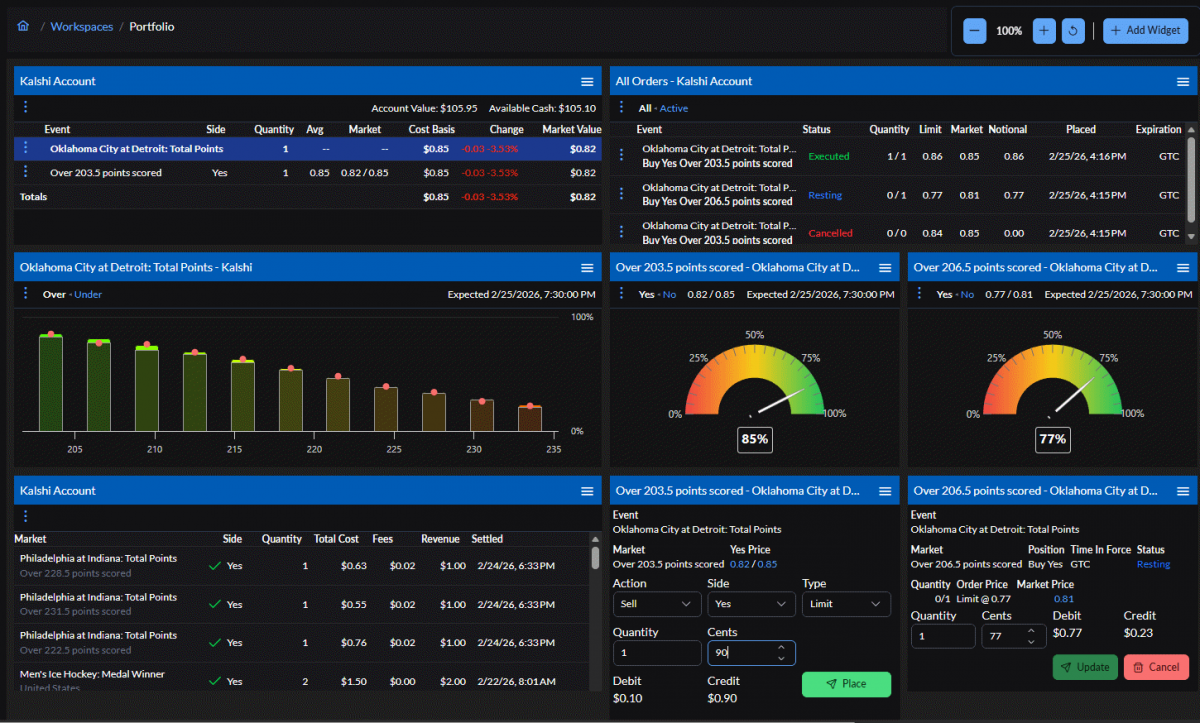
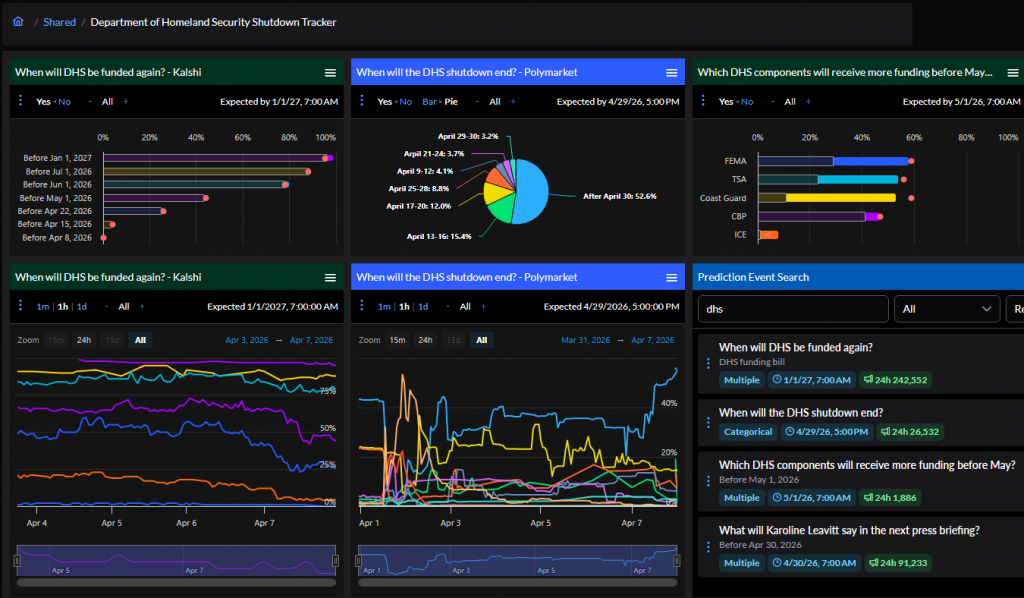
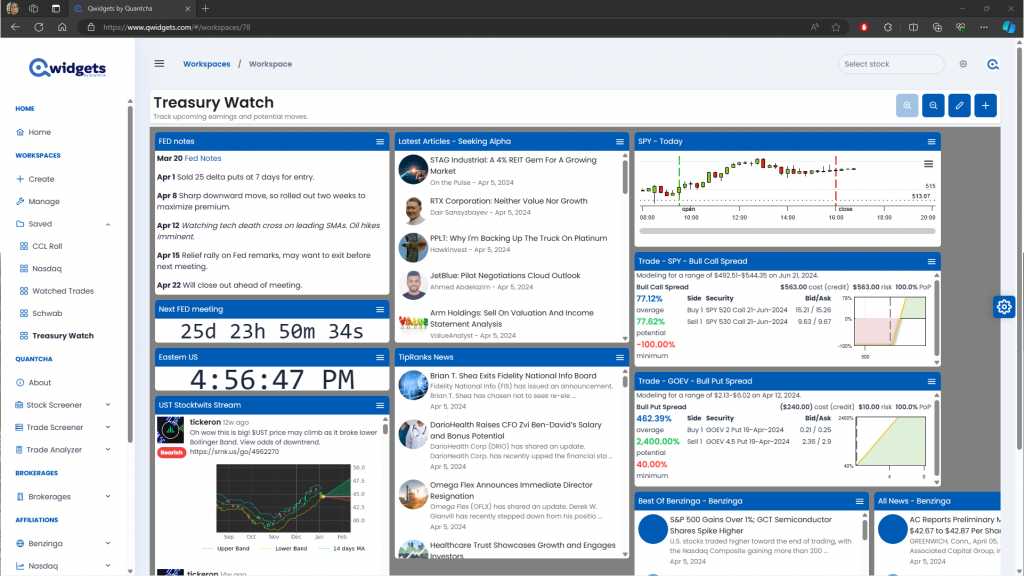
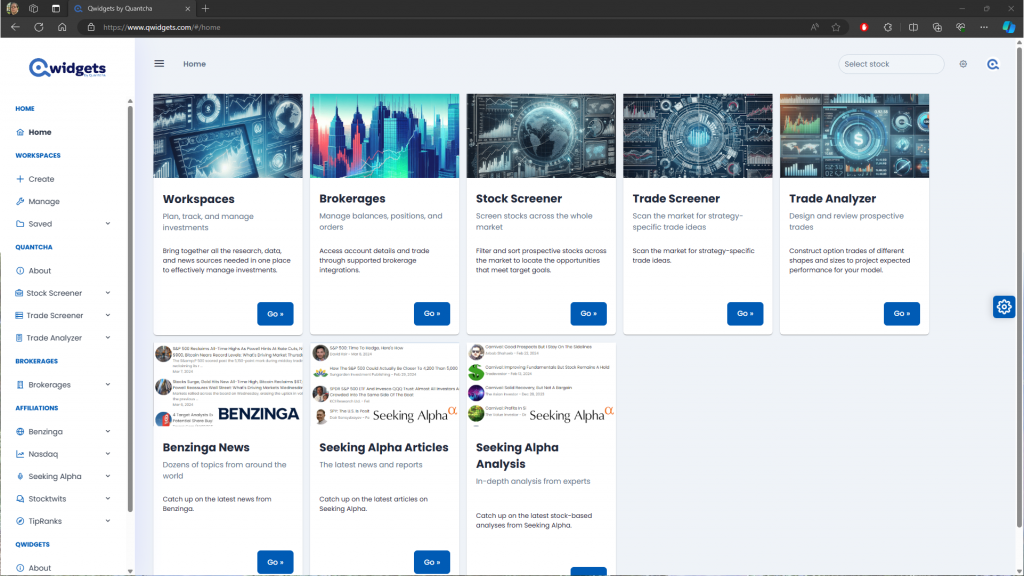
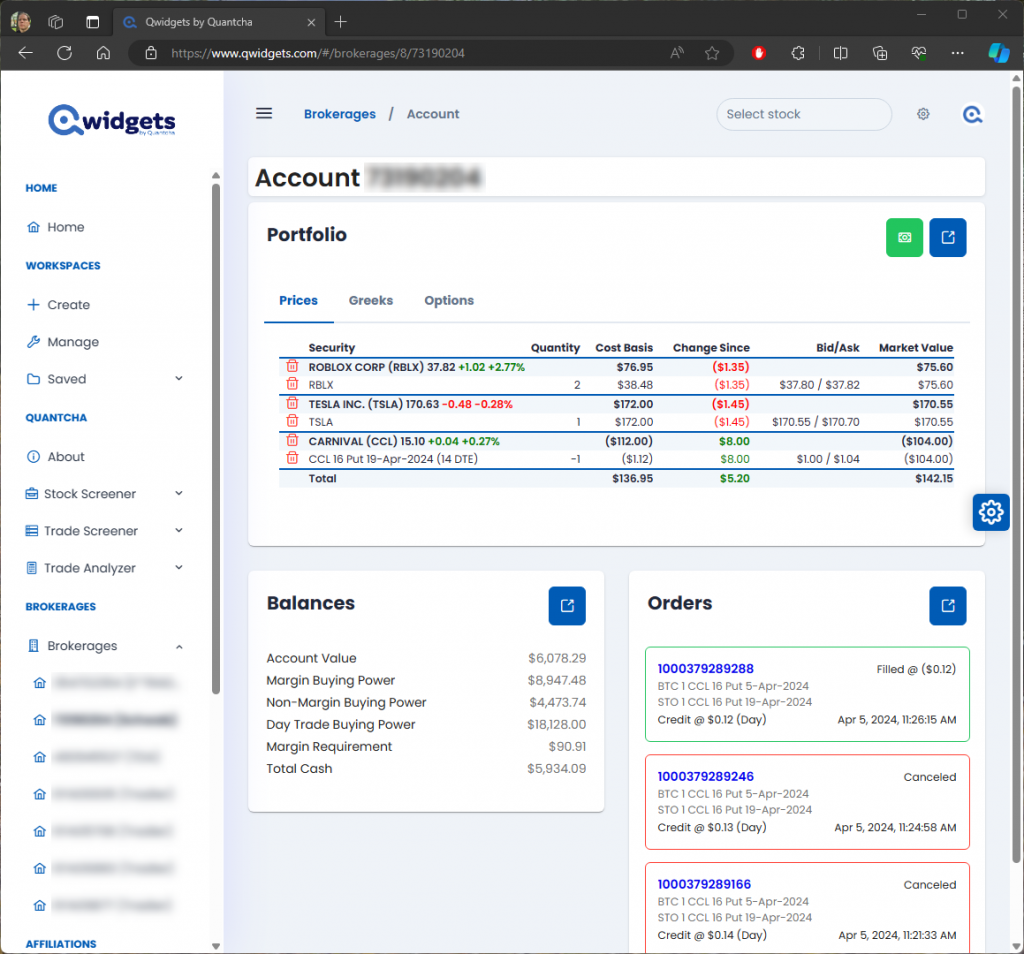
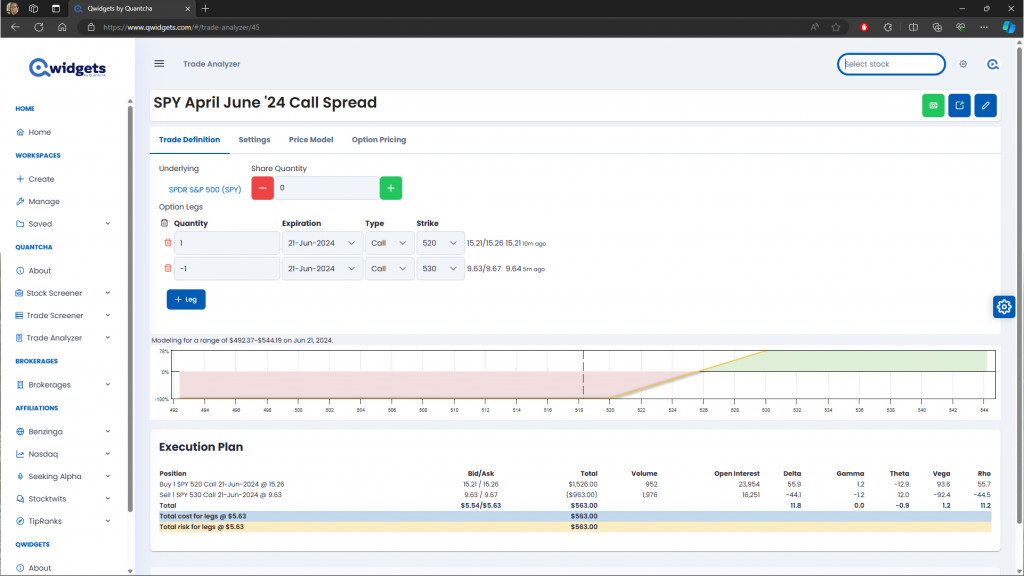
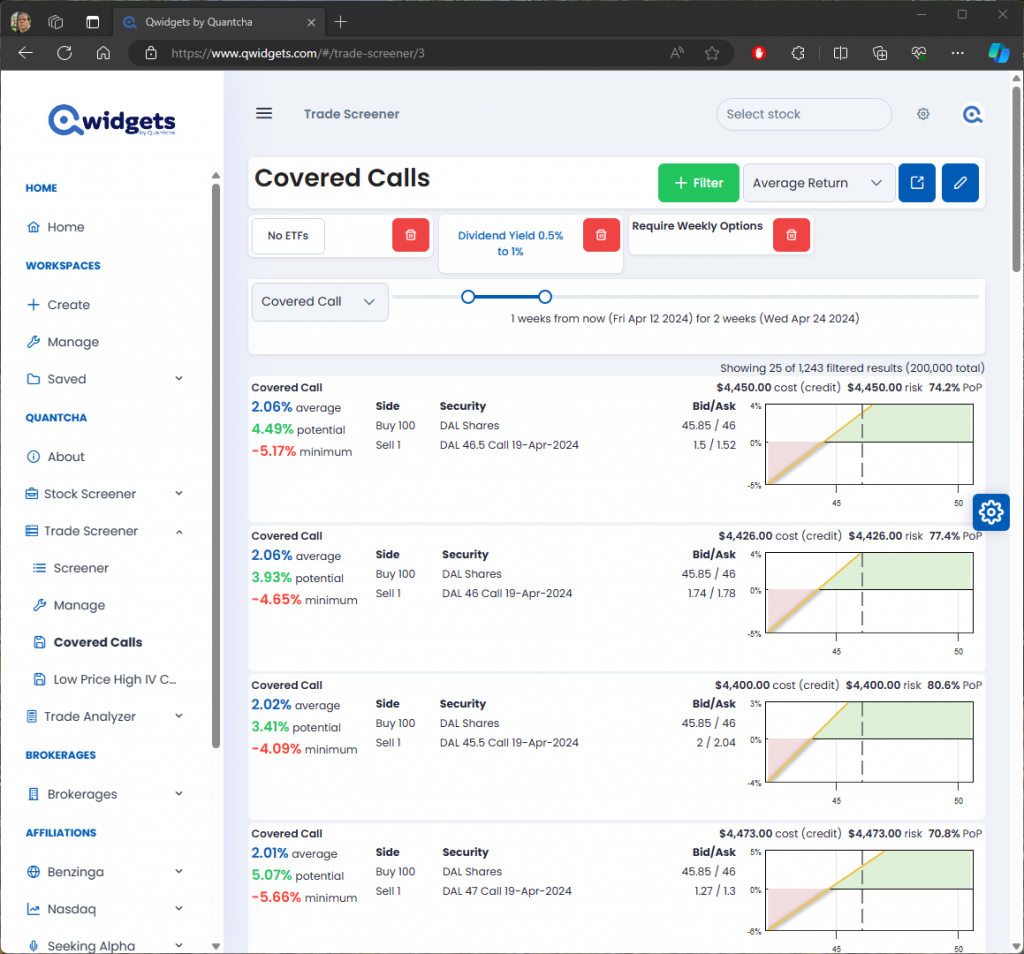
Consequitur is a sister product to Qwidgets for Prediction Markets, Quantcha’s within-market analytics platform: Qwidgets covers comparing and trading contracts across exchanges, while Consequitur covers the relationships between the events themselves.
Explore the graph, set your estimates, and model a what-if at www.consequitur.com.