Every options investor needs an edge, and the edge we offer reaches way beyond our industry-leading tools.
We spend a lot of time talking about how our tooling features provide investors an edge when managing their option portfolios. We also talk a lot about how we make standard data, such as pricing and implied volatility, accessible and integrated throughout the platform. But our continued research has uncovered unique data needs that nobody else has solved—so we did.
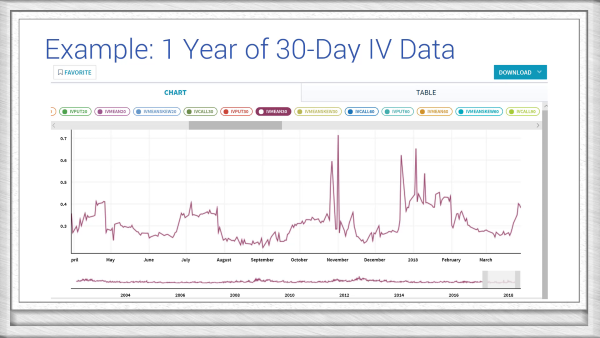
One of the most common challenges options investors face is evaluating the current IV of a stock. For example, if a stock’s options are implying a volatility of 40%, is that a good time to sell its volatility? Or buy it? Or is that just typical? There have been some interesting solutions, such as IV Rank and IV Percentile, but neither truly addressed the question traders were asking: what is the probability that volatility will drop from its current level? That’s where the Quantcha Volatility Rating™ (IV Rating) comes in. It distills IV data down to a likelihood of IV dropping from its current level.
To learn more about volatility valuation (covering IV Rating, IV Rank, and IV Percentile), please check out our video on YouTube:
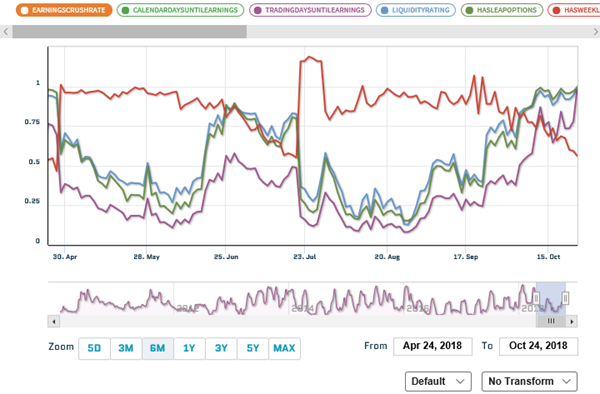
Many options investors focus their efforts on trading volatility around earnings. It’s really risky, but that’s why it can also be extremely rewarding. While IV is always inflated leading into an announcement, it’s not easy to evaluate the pricing for options expiring immediately after earnings. Sometimes the near-term options are too rich relative to further dated options and calendar trades can be opened to profit from the disparity. This is where the Quantcha Earnings Crush Rate™ comes in. It provides the measurement for how much volatility the earnings options are expected to retain following the announcement. Seasoned investors can then gauge which side of the risk they want to be on in order to profit from potential mispricing.
To learn more about earnings crush, please check out our video on YouTube:
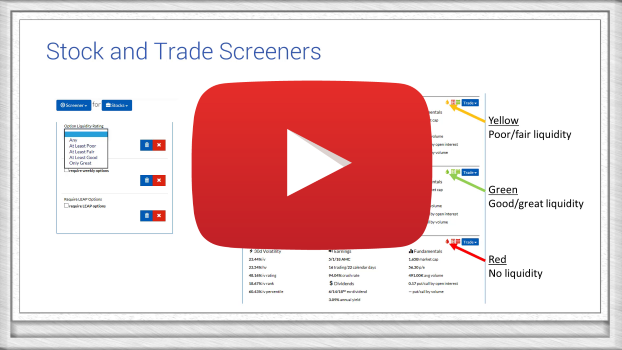
Using stock or trade screeners is a great way to find great option trade candidates. However, these great opportunities can often vanish once it’s uncovered that the option liquidity doesn’t provide efficient trading opportunities. This is where the Quantcha Liquidity Rating™ comes in. It distills option liquidity for all optionable stocks down to a 1-5 scale using a multitude of properties around a stock’s options. These factors in their bid/ask spread, open interest, volume, strike distance, and more. This makes it very easy to filter out candidate stocks that don’t offer the option liquidity you’re looking for.
To learn more about option liquidity, please check out our video on YouTube:
In addition to the integration of our proprietary data throughout our tools, we also provide it via API. If you’re interested in integrating it into our personal or professional tools or services, please check out our data API.
To learn more about our data API options, please check out our series on YouTube: