
Kalshi didn’t build its own thermometer for you to bet on temperature coin flips.
On October 1, Kalshi filed a new set of contracts with the CFTC: temperature indexes for 13 metro areas. One line in the terms caught my eye. “The Source Agency is Kalshi.” The exchange isn’t settling these on the National Weather Service or a weather vendor. It built the thermometer.
Puget Sound is on the list, so I took it personally. (I can save everyone the trouble on that one: 58 and drizzling.) I pulled every trade and came away with two impressions. People are using this. And it doesn’t look finished.
What’s actually listed
Four of the 13 have markets today: Miami, New York, Chicago, and coastal Los Angeles. Every hour, each gets ten fresh contracts with strikes one degree apart, all asking whether the index will be above that level at the top of the next hour. Each trades for 60 minutes and settles on the reading at the top of the hour.
The index is an average of airport weather stations, eight in New York and five in Miami, recalculated every minute and published to a hundredth of a degree. That precision is mostly arithmetic. Each station reports in whole degrees Celsius, and Synoptic, the data provider, lists that among the limitations that mean these readings “must not be used for aviation.” It has yet to weigh in on fitness for hedging your ice cream shop.
Miami has traded hourly since August 15. (Earlier hourly versions settled on a single reading from The Weather Company. Kalshi’s blended model blows away the risks previously exposed by Polymarket’s Hairdryergate.) Since launch, buyers have paid about $11 million for 18.4 million contracts, which is a lot of interest in whether Chicago will be 61 or 62 degrees at 3 PM.
It’s 72 now. What will it be in an hour?
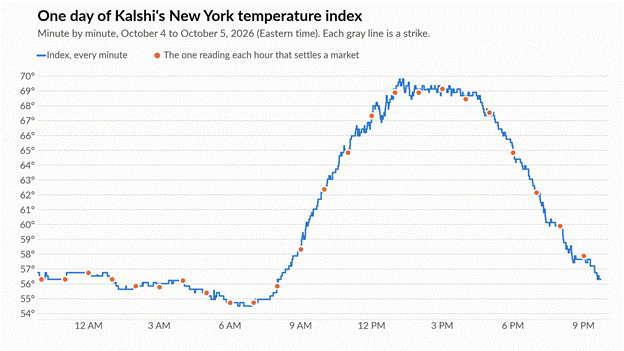
That was my first reaction, and the data mostly agrees. Across about 3,000 hours, the typical hourly move is 0.7 degrees, and in 58% of hours the index moves less than one. Temperature follows the sun, so the hour of the day alone explains more than half of the change in New York, Chicago, and Los Angeles. (Miami comes in at 28%. Afternoon thunderstorms keep their own schedule.)
In other words, most hours come down to one strike, and the question is whether the index steps across a whole degree before the clock runs out. With five stations, one thermometer ticking over moves the index about a third of a degree, so near a strike you’re partly trading rounding. You can see the staircase in the chart.
You can’t trade the timing
This is where the options trader in me got stuck. Say I think New York slides to 60 by 8 PM, but I don’t know which hour gets it there. The natural trade is to own the 8 PM contract and sell the earlier hours against it until it happens. That’s a calendar spread.
Unfortunately, it can’t be built. Each market is created about ten minutes before it opens, lives for an hour, and nothing lists behind it. There is exactly one expiration at any moment, so the view I’d want to express—about when—is something I can’t trade.
Who comes out ahead
My first research pass covered three days and indicated buyers of near-certain outcomes at 95¢ and up were quietly coming out ahead. That would have made a tidy sequel to last week’s piece on premium sellers, but then I decided to run the full history to make sure. I pulled all 603,661 trades back to launch and grouped the buyers who crossed the spread by the price they paid. Turns out there’s no reliable winner, especially once you extract fees.
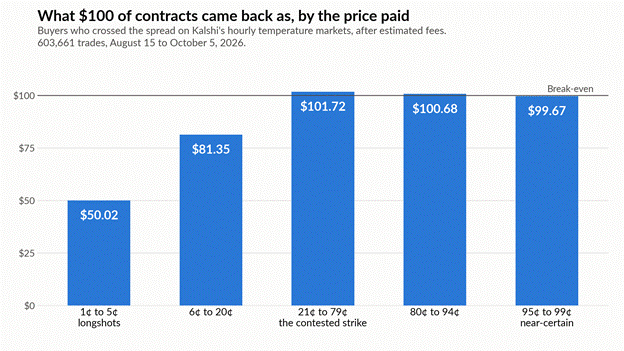
Buyers at 95¢ to 99¢ won 98.1% of the time at an average price of 98.3¢ and lost about 0.3% after fees. Last week’s long-dated favorites paid crumbs. Compressed into an hour, they pay slightly less. Longshot contracts at 5¢ or less paid off 1.7% of the time, which works out to losing half the stake.
The interesting group is in the middle. Between 21¢ and 79¢, buyers won 53.1% of the time at an average price of 50.6¢. That’s about 1.7% after fees, or roughly $59,000 across four cities since launch. Somebody hitting those quotes knows slightly more than the quote does. My guess is they’re watching the station data directly, but I can only see trades, not accounts.
Add everyone up and they made about $131,000 before fees and paid an estimated $152,000 in fees. The steadiest earner in an hourly temperature market is the exchange. That’s how exchanges are supposed to work, but it’s worth knowing before you take up thermometer trading as a side income.
Who are these actually for?
The good news is that there’s a clear user today: people want something to trade every hour, and the volume says they’ve found it. The prices are honest, too. Over the full history, a contract bought at 75¢ paid off about 75% of the time. But I don’t think hourly traders are who Kalshi built this for.
Where I think this is going
Too much of what Kalshi built is sitting unused. The index runs every minute in 13 metros and gets used once an hour in four. The filed terms allow contracts on any period from a minute to a year, plus a second type that pays if the index touches a level at any point in the period. A daylong version of that is the long leg of the calendar I couldn’t build. None of it’s listed yet.
Then there’s the list of metros. It includes Kansas City and Southeast Michigan, where I can’t find a daily temperature market on Kalshi, and skips Atlanta, Phoenix, and Denver, where there is one. Most of the 13 are big load centers in the country’s organized power markets, and temperature is what moves power demand. Kalshi already lists contracts on peak electricity demand in Texas, and this week new power price series for hubs in Texas, the Midwest, and the mid-Atlantic showed up in its public market data with nothing trading on them yet.
So here’s my read: the hourly markets are the onramp. They give a brand new index a track record and a crowd before anything larger sits on top of it. What comes next is a weather-and-power complex, with a city’s temperature trading next to its price of power. The real customer for that is anyone whose costs move with both, like a utility, a power trader, or a data center operator. It’s the same order of operations I wrote about in compute: ladders first, continuous products behind them.
None of this has been announced, and I could be reading a rollout schedule as a strategy. Weather hedgers also trade degree days, which add up over a season, and nothing in the filed terms does that.
Where I land
As listed, an hourly temperature market is mostly a coin flip on one degree with a fee attached, and the trade I’d potentially be interested in isn’t available. As a foundation, it’s more compelling than it looks. I’ll be watching which metros light up next and whether those power hubs get markets. If Kalshi listed a full day of hours at once, would you trade the calendar?
