
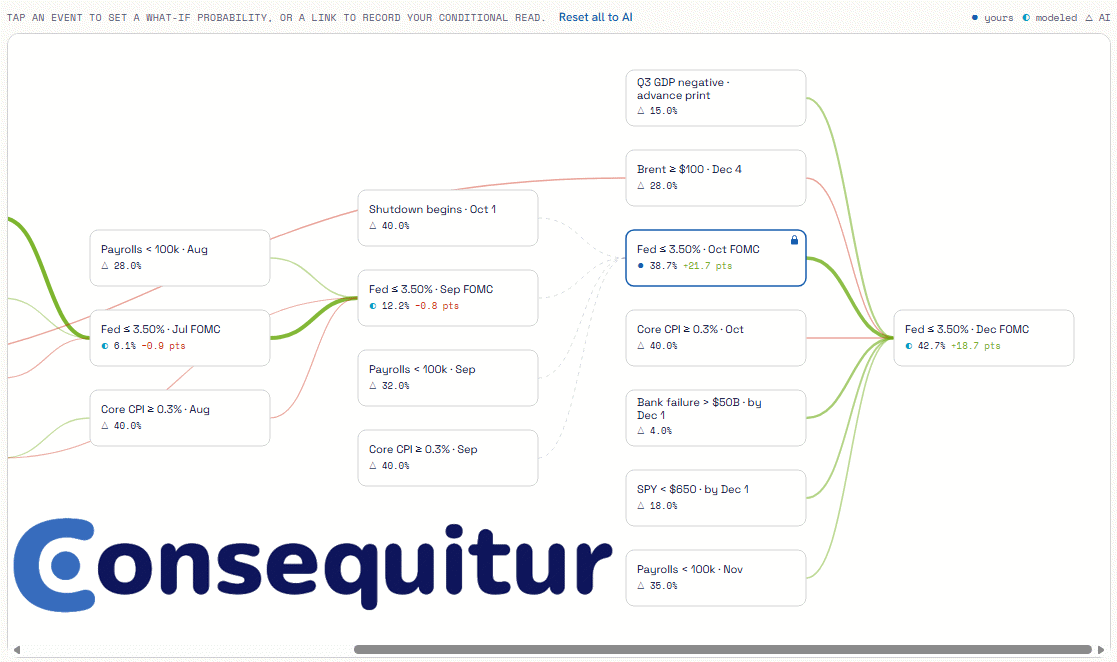
I built something to fill the nagging gap between traditional options and event contracts.
On election night, Spencer Pratt led the second runoff spot in the Los Angeles mayor’s race by about eight points. The lead shrank a little with each new batch of ballots. The prediction market contract on whether he’d advance to November fell from the high 70s into the low 20s. And if advancement resolves against him, the contract on whether he’ll win the mayoralty in November won’t just reprice, it will end.
Nobody needs a tool to see that coming. Everyone knows that advancing in June is a precondition for winning in November. That part is obvious. But sitting underneath the obvious part is something more useful, and you can read it straight off the screen.
What two listed prices told you before the June election
Winning required advancing, so the November contract was really two things multiplied together: the chance he’d advance, and the chance he’d win if he did. Pull the two listed prices apart and the second piece falls out on its own. His win-if-advanced probability was just the November price divided by the advancement price. Advancement was trading around the high 70s before the primary. The outright-win contract was around a third. So the market was already saying that if he cleared June, the November price should jump to roughly the low 40s, and that if he didn’t, it should go to zero. Both numbers were priced in advance. The count only picks which one comes true.
That same number was also a hedge ratio. If you held the November outcome and wanted out of the advancement risk in particular, you could short the June contract in that proportion and keep a clean view on the runoff itself. As the count came in and his advancement odds slid, the ratio moved, and the hedge moved with it. One conditional probability was doing two jobs at once: the level the November price would snap to on advancement, and the ratio that offset one contract against the other. You could get it by dividing two quoted prices.
Unfortunately, it’s usually not that easy
You could only do any of that because the relationship was total and both contracts were listed. That is the rare corner. Picture a spectrum. At one end the sensitivity is essentially one: the first event all but determines the second, and the link is too obvious to need help. At the other end the events have nothing to do with each other, the sensitivity is zero, and there is nothing to model. Both ends are easy. Neither is where money gets left on the table.
The middle is where the opportunity lies. Most real relationships between events are partial price drivers. One event moves another by a meaningful amount without determining it. Had Pratt advanced, markets on whether stricter voter ID rules passed, or whether mail-in voting was restricted, would move his runoff odds. Not all the way, the way the advancement market did, but by a real amount. Those are the relationships that actually move a book, and they are the ones you cannot recover by dividing two prices. There is usually no listed contract for conditionals that pair them, and the relationship is not a clean nesting. Markets price whether a single event happens, continuously and in public. What nothing quotes is how one event moves another. The Pratt advancement/election pair was legible only because it was the exception.
What options have that event contracts don’t
In options, the reason you can manage a book at all is that you can take it apart. You know what each position is sensitive to. You can add those sensitivities up across the book. You can build a hedge that offsets the exposure you do not want. The machinery for that is the Greeks. The simplest one is delta: how much a position moves when the thing underneath it moves.
Binary event contracts have nothing like it. The continuous-price math the Greeks come from does not translate to a contract that settles at zero or one (setting aside certain scenarios with financial security underlyings). But the job delta does still needs doing: tell me what moves this position, and by how much, so I can offset it. The Pratt pair is that whole problem in miniature. When the relationship is total and both legs are listed, the answer is a division you can do in your head. Everywhere else, it’s invisible.
I’ve spent some time working out what the general version looks like, and I keep landing in the same place. For a standalone event, the closest thing to delta is the set of conditional relationships around it: the other events whose outcomes shift the world it resolves in, and by how much. I would not call it delta. It’s the event-contract analog—the same question delta answers—asked over events instead of a price. And it’s a cleaner object in one way and a rougher one in another. Cleaner, because a binary book moves in a straight line: there is no second-order curvature to chase, no gamma to manage. Rougher, because the number is only as good as your estimate of the relationship, and sharpening that estimate is exactly what the crowd is there to do. Map enough of those relationships across the positions you hold, and you have something that plays the role a risk book plays on a trading desk, expressed over events instead of prices.
Introducing Consequitur
Consequitur is the first working piece of that idea. The public beta is live now at consequitur.com. It’s free with no registration required. You can explore the graph, set your own estimates, and run scenarios without an account.
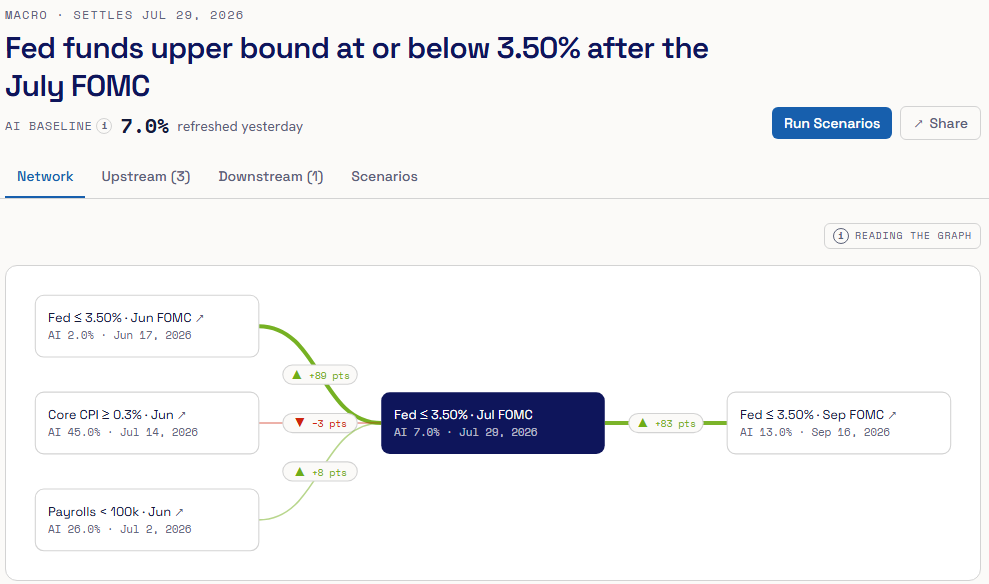
It’s a graph of real-world events and the relationships between them. Every event carries a live baseline probability, drawn from market prices where a market exists. Every link between two events carries a starting estimate of how strongly one bears on the other. Where you disagree with a link, you set your own number. Then you run the what-if: adjust the marginal probabilities of events in the network and watch the implied probabilities move across everything connected to them.
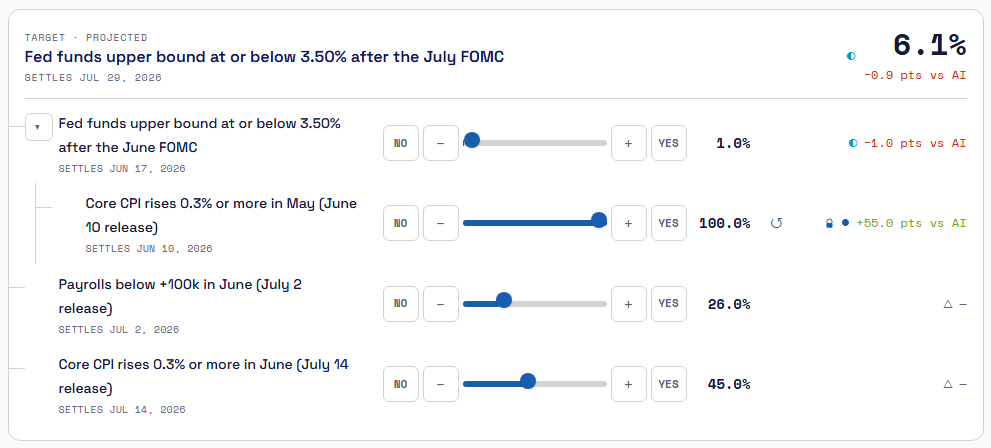
The beta opens on a single anchor, the question most likely to move every other market this year: does the Fed deliver at least one cut in 2026? Around it sits a graph of inflation prints, labor data, energy, and geopolitics. That includes the cascade I mentioned earlier: a ceasefire holding or breaking, feeding oil, feeding inflation, feeding the Fed. Every link in that chain is a partial price driver. None of them is obvious, none is deliberately priced anywhere, and all of them are regularly refreshed. Pin the ceasefire to “collapsed” and watch the pressure travel down the chain to the rate decision. That is the everywhere version of what you got to watch happen once, in the open, with Pratt.
The roadmap
This beta is a down payment on a broader vision of tools that anyone can use to better manage a portfolio of event contracts. It will include more interactivity to support setting position quantities in order to explore how various events are likely to impact position and portfolio value. It will make it easier to identify hedging opportunities that lower risk, including ones that wouldn’t be obvious otherwise. And because those hedges fall out of the sensitivities you declare, the same machinery shows you where a contract is priced out of step with your view—the event contract version of an option looking cheap or rich against your read on volatility. It will provide better insight into the systematic and unsystematic risk components of event prices so you can easily understand how much probability is independent vs. sensitive to other tracked events.
None of that ships today. What is live is the Fed graph, your own estimates, and what-if scenarios. One anchor, free, no signup. The data layer is step one. The workflow on top of it is what comes next, and I would rather build it in the open than oversell it.
Building in the open includes being explicit about the methodology. If you want the precise version of what each number means, how the engine moves a shock through the graph, and where the model breaks, I published a technical document with the launch. It’s a systems document, not a sales pitch. The limitations section is the longest part on purpose.
Try it
If you trade these markets, or you just want to see what it looks like to put real numbers on the relationships between events instead of carrying them around in your head, the Fed graph is the place to start. Pin an event, break the chain, and watch what moves. It’s at consequitur.com.
Consequitur is a sister product to Qwidgets, which I built for comparing and trading contracts across exchanges. Qwidgets is about the contracts. Consequitur is about the relationships between the events behind them. For now they’re independent (and separate from the option market products) but we’ll see where the road takes us.
Thanks in advance for any feedback.
