We’re proud to announce that we’ve recently deployed a set of great new charting features that enable investors to be even more successful.

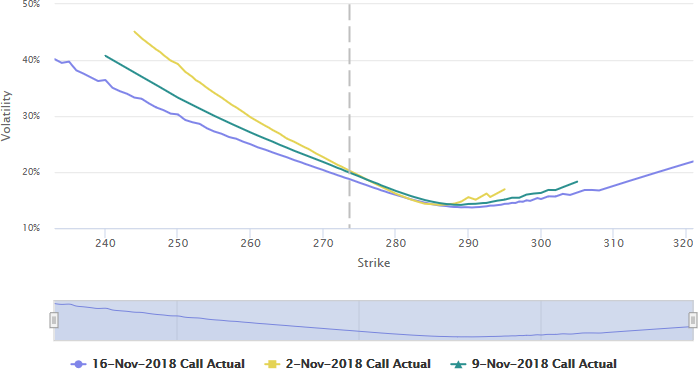
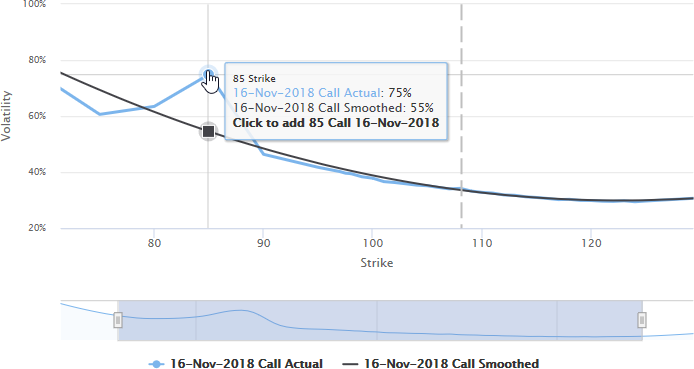
You can now chart option chains using a variety of axes to locate opportunities based on market conditions. This enables common scenarios, such as implied volatility by strike, but also more specialized cases, such as delta by bid/ask mean.

You can also click points on a chart to add the option they represent to a pending book. This book is collected at the bottom of the screen and can be edited across charts.

When you’re ready, you can then model the pending book against your current holdings in the book manager, or send it directly to a trade ticket.

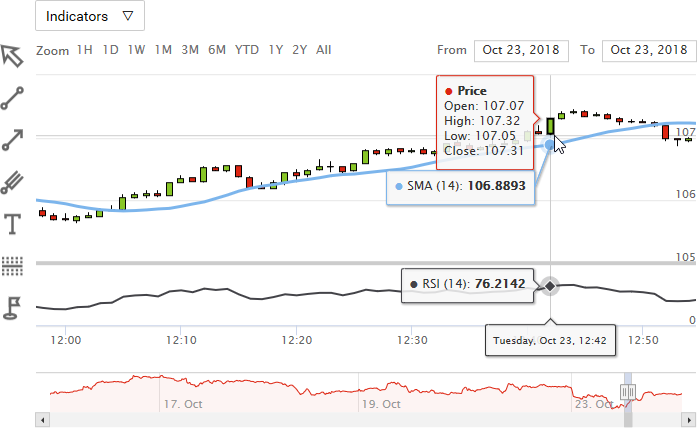
We’ve also invested in deeper brokerage integration to enable you to pull in non-delayed quotes for use throughout Quantcha. One of the places this is most useful is in analyzing price movement in our up-to-the-minute stock charts.

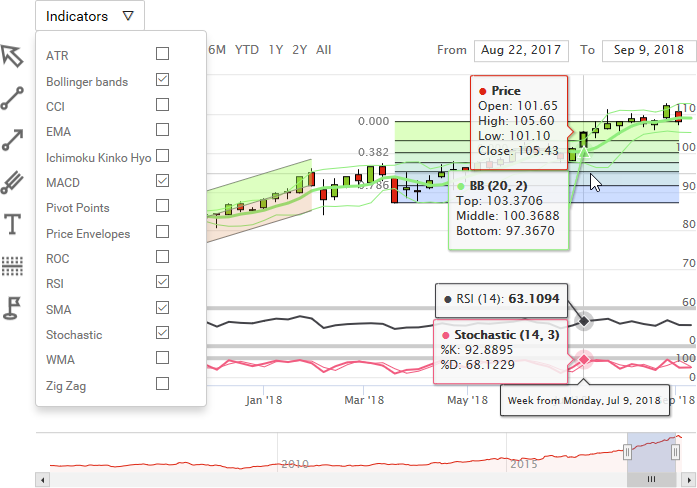
These charts also support a variety of indicators, as well as drawing capabilities. This allows for more sophisticated stock analysis in order to better inform your option views.
We will continue to invest in expanding our charting support, and always welcome your feedback. If you have ideas, please let us know.

