There are thousands of optionable stocks on the market, but they’re not all equal.
Options investors looking for new opportunities often seek out stocks that meet specific technical criteria. These criteria can be related to a wide variety of factors ranging from stock fundamentals to price movement to corporate events and even to the nature of the stock’s options themselves. Zeroing in on the stocks you’re looking for can be a challenge, which is where Quantcha’s options-optimized stock screener comes in.
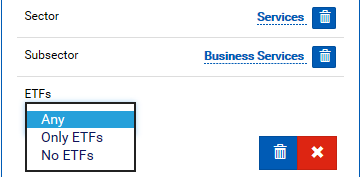
At its core, the stock screener is all about filtering out stocks that don’t meet your needs. There are many types of filters, starting with filters for the sector and type. For example, you can filter by ETF whether you want to see only ETFs, no ETFs, or all stocks.
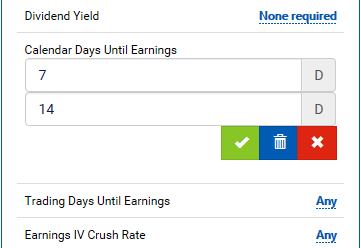
You can also filter by dividends and earnings. If you’re looking for dividend stocks, you can specify the minimum yield you want to see. For earnings, you can filter down to stocks based on how near their next report is in calendar and/or trading das. You can also filter by Quantcha’s proprietary Earnings Crush Rate.
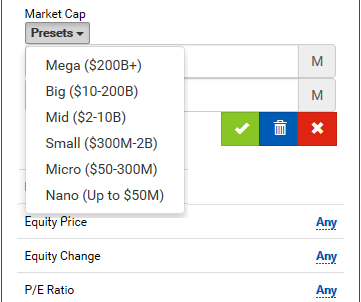
Next, there are filters for company fundamentals, such as the market cap and price per share. You can manually specify a market cap range (in millions), or use one of the presets to quickly filter down to a specific group. You can also filter by today’s change and the P/E ratio.
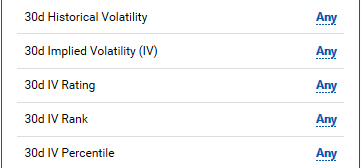
There are multiple ways to filter by volatility, including the 30d historical and implied volatilities. You can also filter by three different volatility valuation measurements: IV Rank, IV Percentile, and Quantcha’s proprietary IV Rating.

The final set of filters help you zero in on stocks that meet your option liquidity requirements. This starts off with Quantcha’s proprietary Liquidity Rating, which is a 1-5 scale that distills how tradeable a stock’s options are based on a multitude of option properties. You can also filter down to stocks that have weekly and LEAP options.
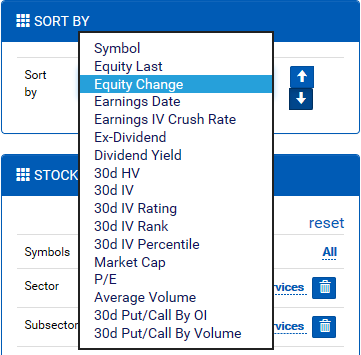
Once you’ve put your filters in place, you can sort by almost any of them.
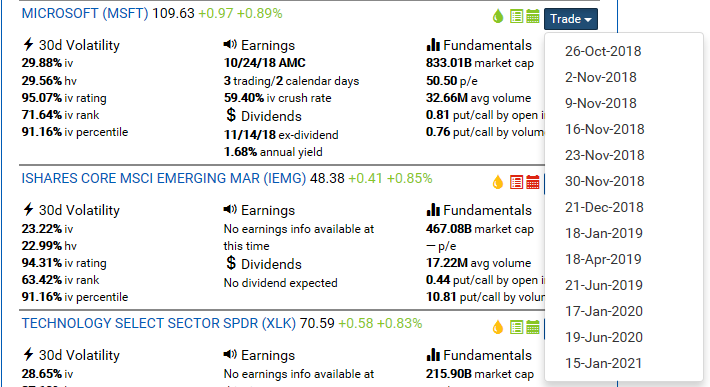
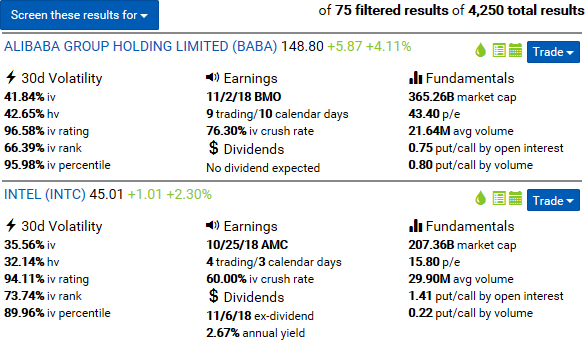
Results are easy to digest. Each includes important details about the stock’s volatility, earnings, dividends, and fundamentals. You also get convenient icons to indicate option liquidity in the top right corner of each result. A green drop is “great” or “good”, a yellow drop is “fair” or “poor”, and a red drop is “none”. If the second icon is green, then the stock offers weekly options. If the third drop is green, it supports LEAP options. Finally, you can jump into the options search engine for a given expiration using the Trade dropdown.
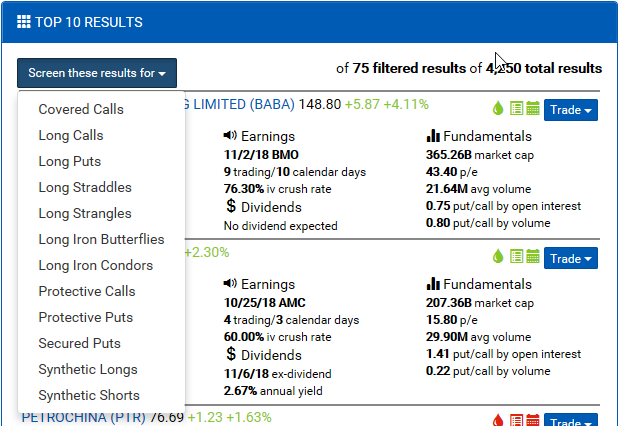
If you find a combination of filters you really like, you can pass them over to one of the strategy-specific trade screeners using the dropdown at the top of the results panel.
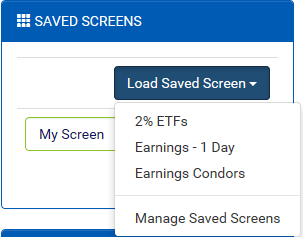
If you regularly look for the same kinds of stocks, it’s also really easy to save and load different screens for recurring use.
To learn more, check out our stock screener tutorial on YouTube:
